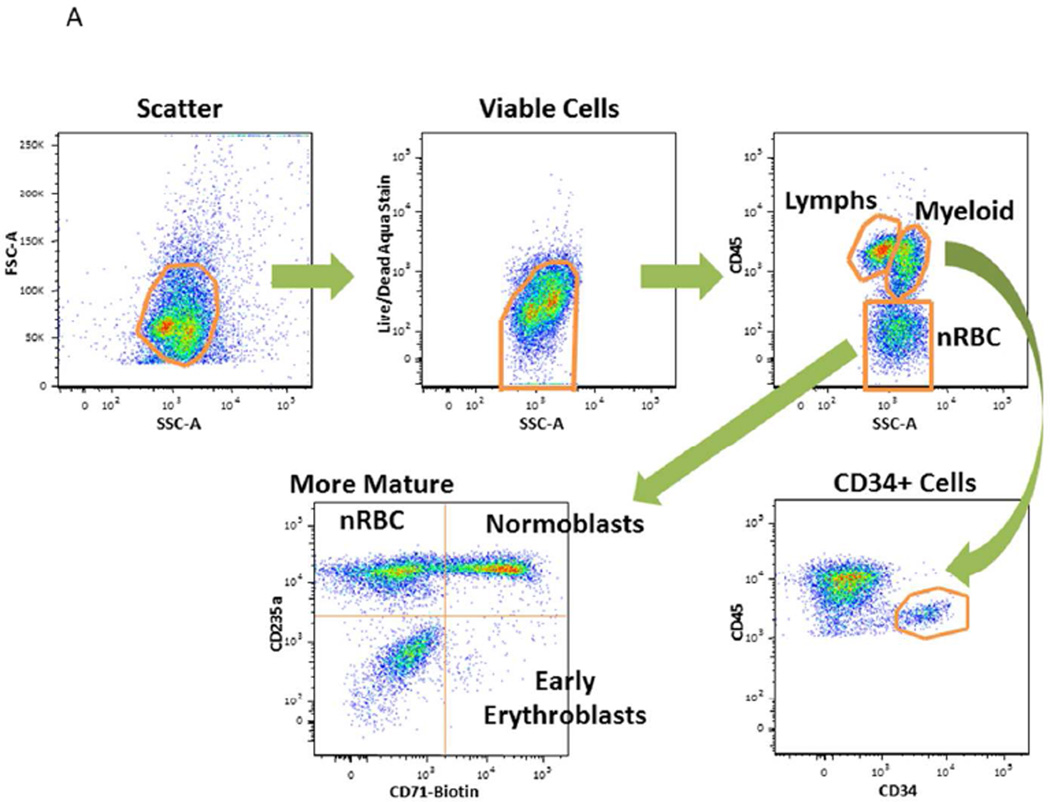
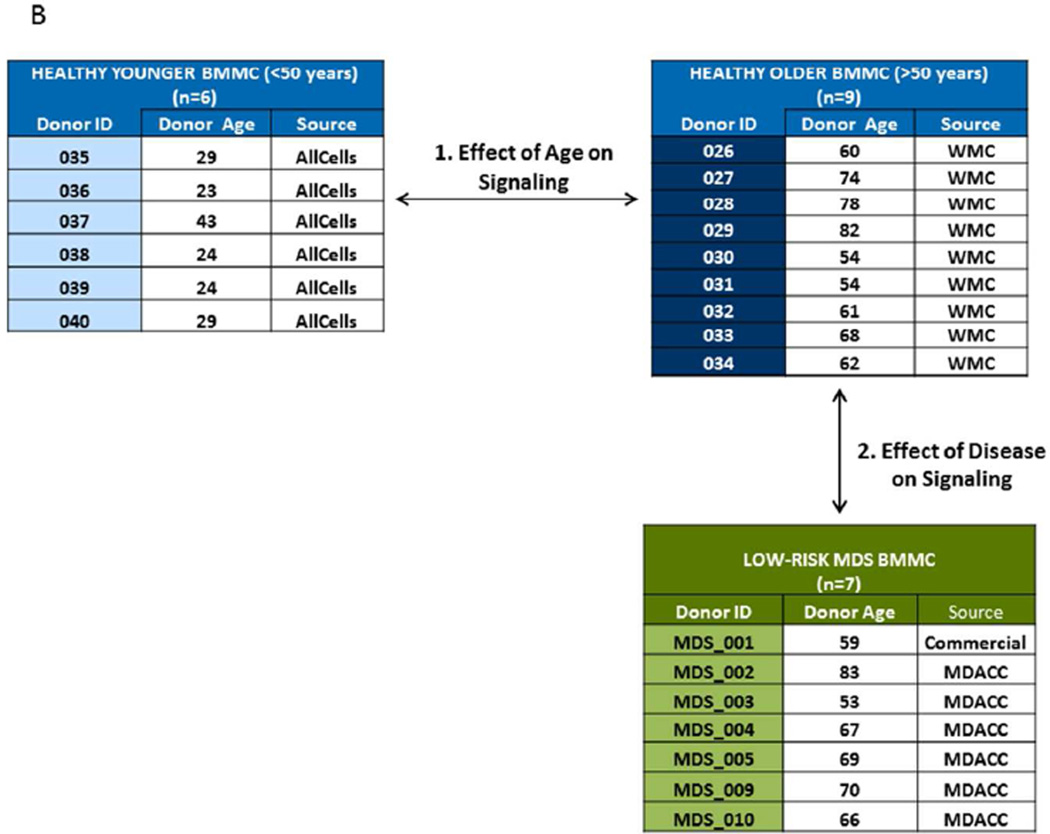
Figure 1. Study Overview.
A. Gating Schema Flow cytometry plots and sequential gating scheme. The first panel is a flow cytometry dot plot indicating how non-cellular debris were included using a FSC and SSC gate. Cells were gated in the second panel using Boolean logic to identify live cells by light scatter that excluded the amine aqua viability dye. The third panel is a flow cytometry dot plot indicating CD45 positive cells; myeloid cells were identified as cells that express the SSC versus CD45 characteristics of myeloid blasts and monocytoid cells; stem cells were identified as cells that express CD45MiCD34+ and nucleated red blood cells (nRBC) were identified as cells that express the SSC versus CD45Lo characteristics. Additional lineage markers such as CD71 and CD235a were used for further identification of nRBC sub-populations as indicated.
B. Study Schema and Sample Characteristics The two-step study involved the comparison of GCSF and EPO -mediated signaling in BMMC samples obtained from “older” versus “younger” donors followed by the identification of dysfunctional signaling by comparison of BMMC from low risk MDS to BMMC from age-matched healthy control. Sample characteristics for healthy BMMC and for MDS samples are listed.


