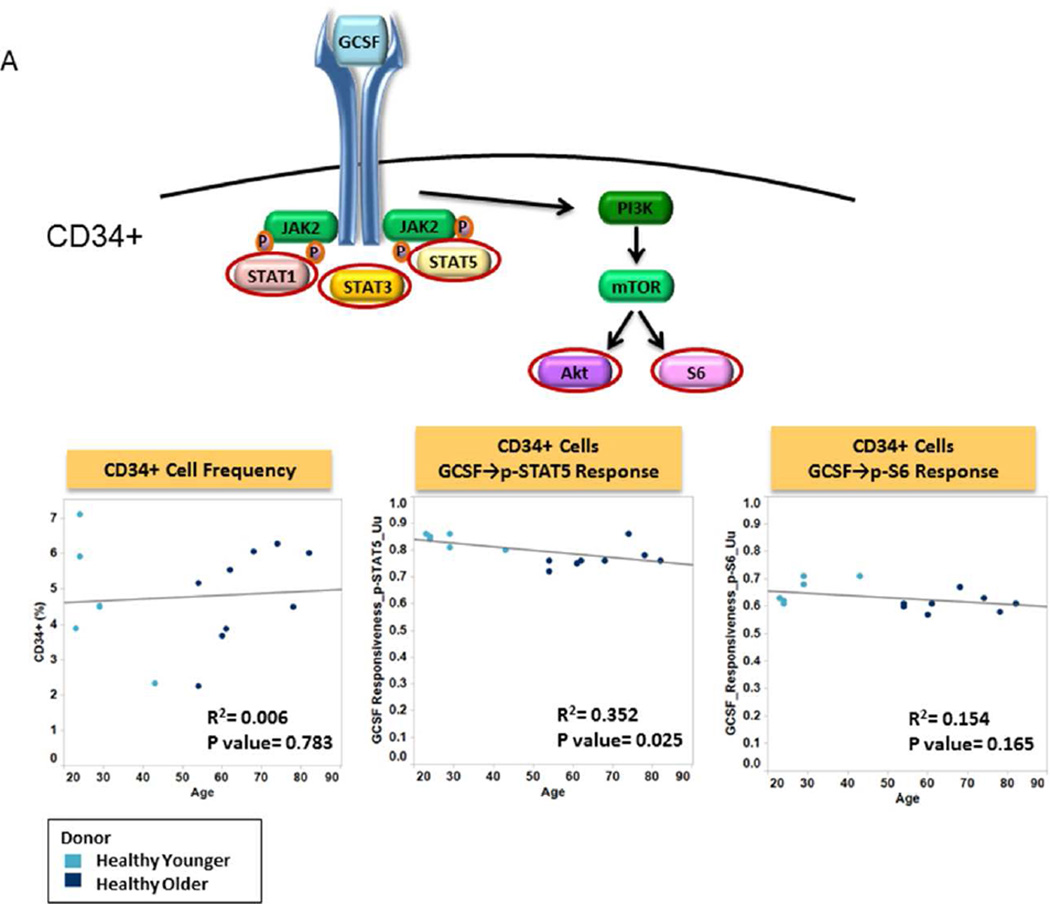
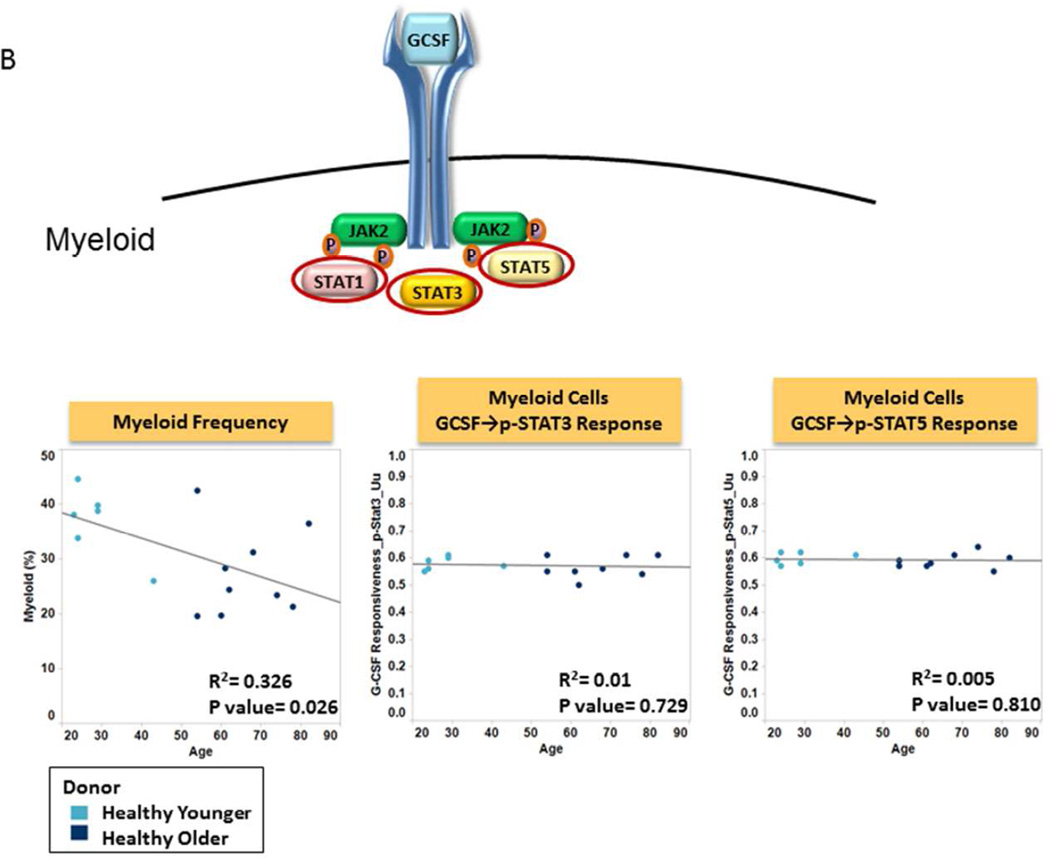
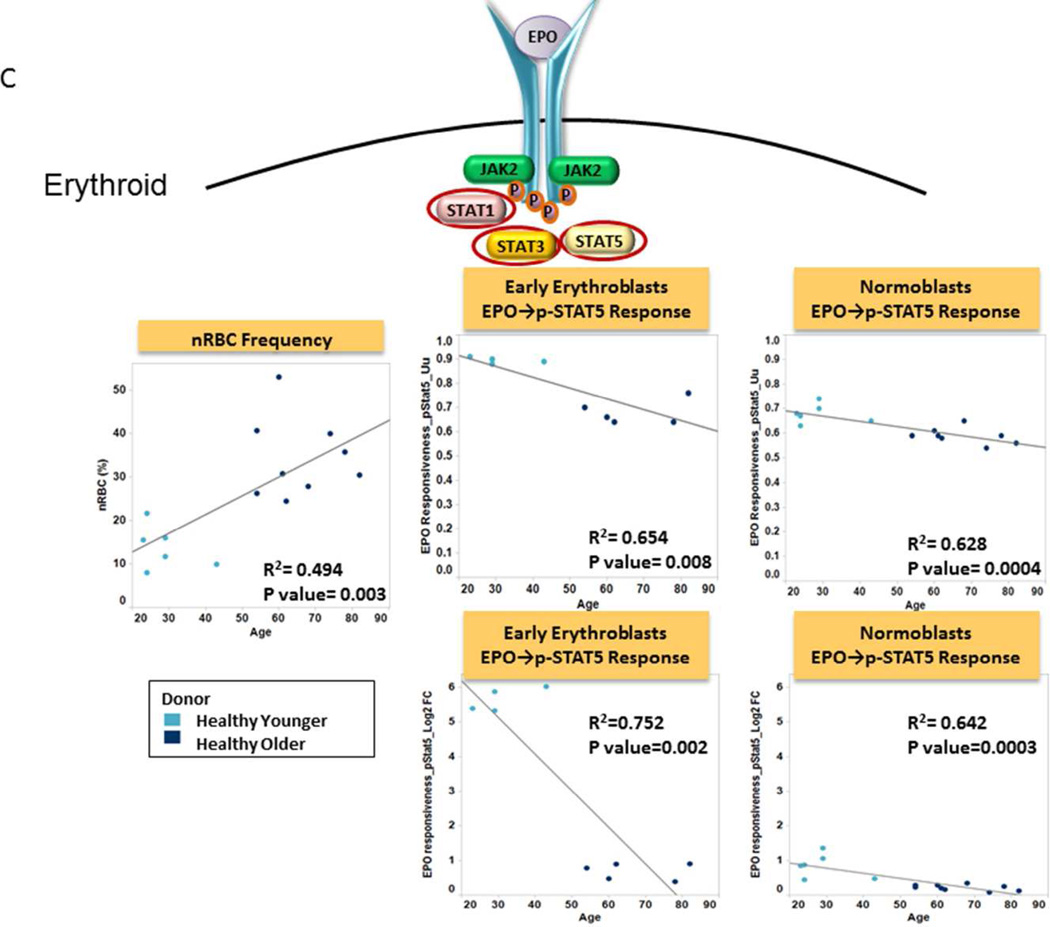
Figure 2. Effect of Donor Age on Bone Marrow sample Signaling Function.
A. Frequency and Function of CD34+ Cells Plots of age versus CD34+% (left panel), GCSF induced STAT signaling (middle) and GCSF induced PI3K pathway (right) in CD34+ cells from older patients (dark blue circles) and from younger patients (light blue circles) using the Uu metric are shown with R-squared (coefficient of determination) and p value. A cartoon of GCSF signaling identifies the phosphoproteins studied circled.
B. Frequency and Function of Myeloid Cells Plots of age versus Myeloid cell% (left panel), GCSF induced STAT signaling (middle, right) in myeloid cells from older patients (dark blue circles) and from younger patients (light blue circles) using the Uu metric. R-squared (coefficient of determination) and p value are shown. A cartoon of GCSF signaling identifies the phosphoproteins studied circled.
C. Frequency and Function of Erythroid Cells Plots of age versus nRBC% (left panel), EPO induced STAT signaling in early erythroblasts (middle) and normoblasts (right) from older patients (dark blue circles) and from younger patients (light blue circles) using the Uu metric (above) and Fold change metric (below). R-squared (coefficient of determination) and p value are shown.. A cartoon of EPO signaling identifies the phosphoproteins studied circled.


