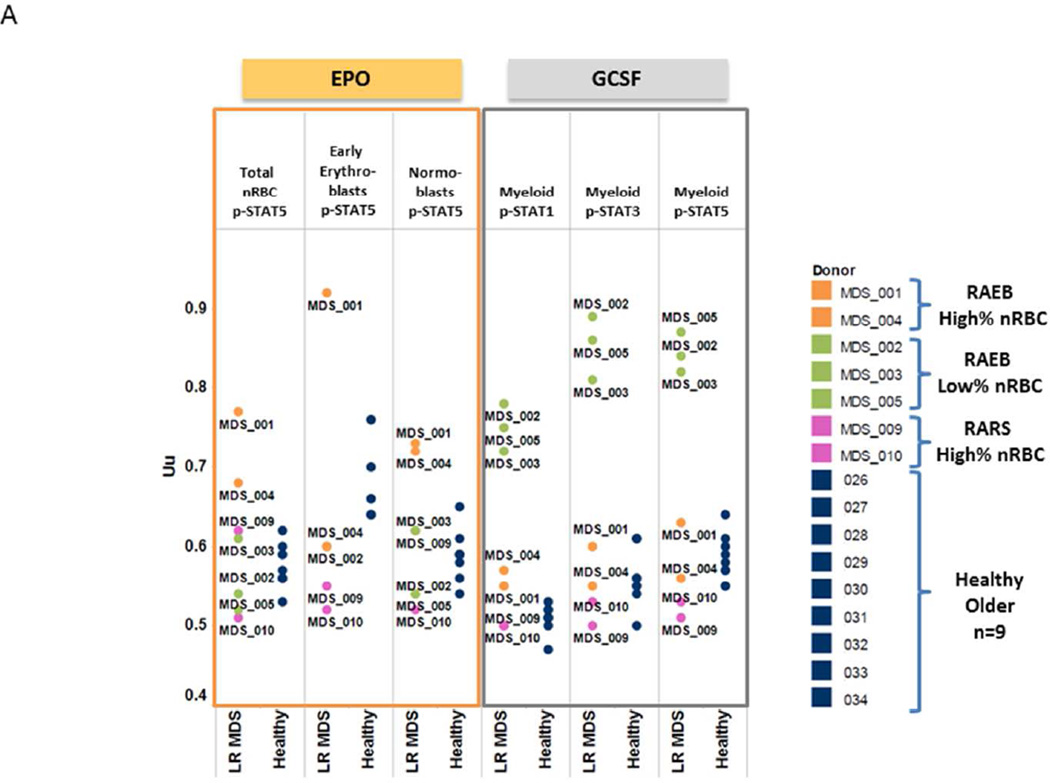
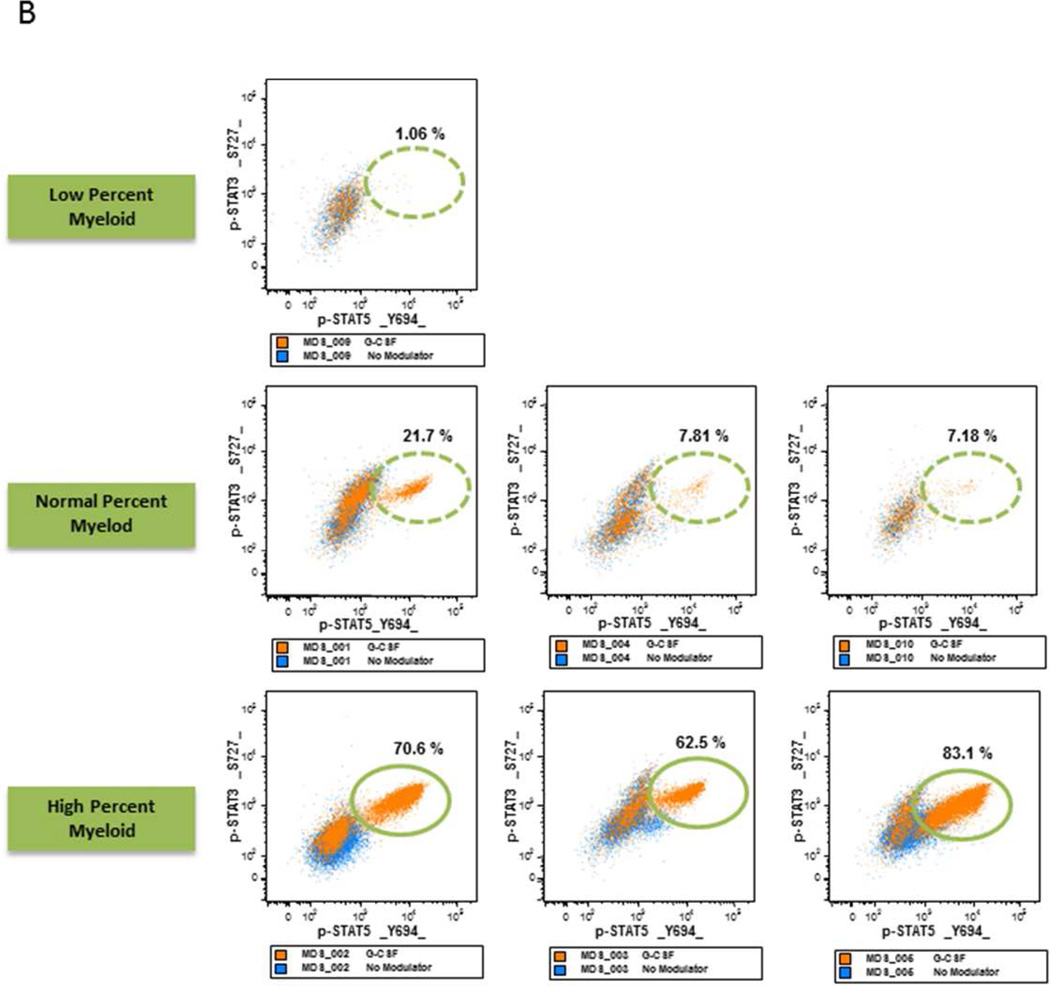
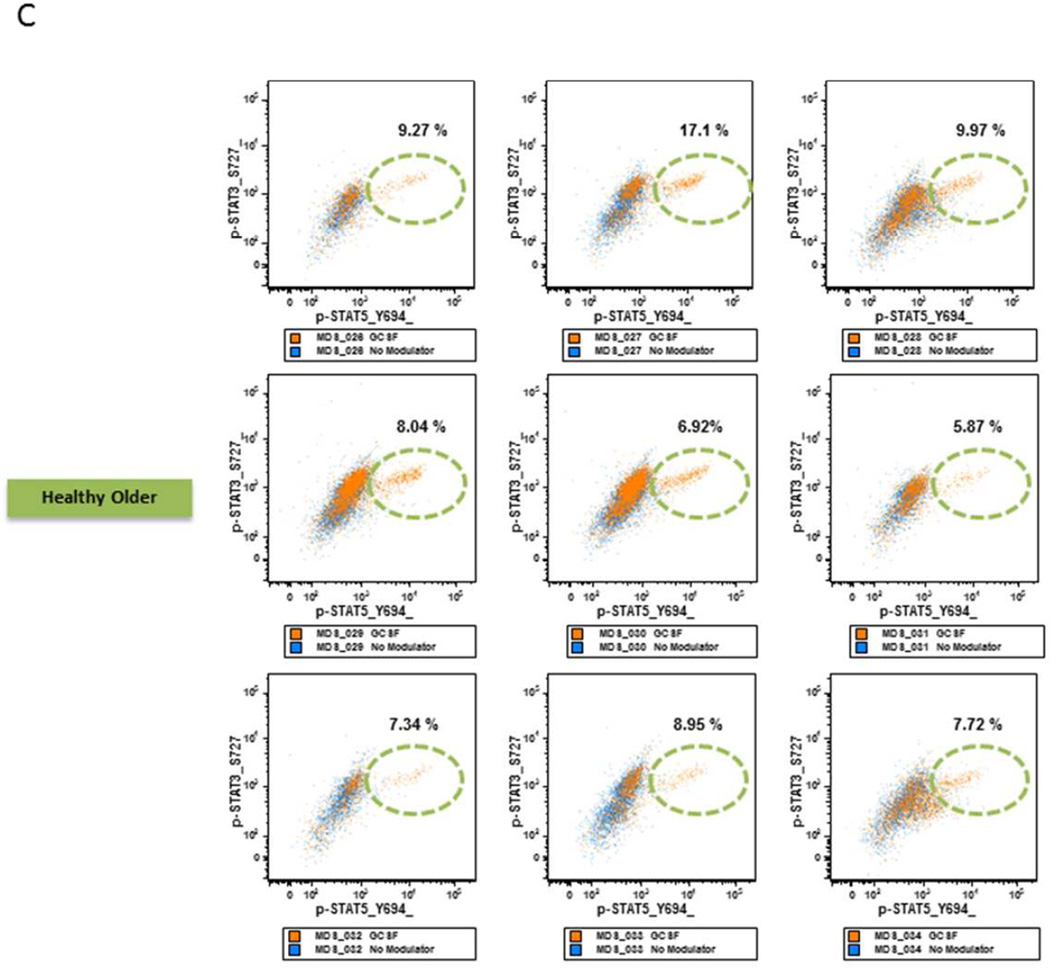
Figure 4. Low Risk MDS BM samples versus Age-Matched Healthy BM samples.
A. Response of MDS BM samples to EPO or GCSF modulation Plots of EPO induced p-STAT5 levels in total nRBC, early erythroid and normoblasts (left) and GCSF induced p-STAT1, p-STAT3 and p-STAT5 levels in myeloid cells using the Uu metric (right).
B. MDS Samples with Increase Myeloid Frequency have Increased STAT Activation Flow cytometry dot plots measuring p-STAT5 (X-axis) versus p-STAT3 (Y axis) in response to GCSF in MDS samples with a higher percentage of myeloid elements (lower panels), same percentage (middle panels) and a lower percentage of myeloid elements (upper panel) compared to healthy age-matched control myeloid samples.
C. GCSF Modulated STAT Activation in Healthy Older BM Samples. Flow cytometry dot plots measuring p-STAT5 (X-axis) versus p-STAT3 (Y axis) in response to GCSF in healthy age-matched control myeloid samples.


