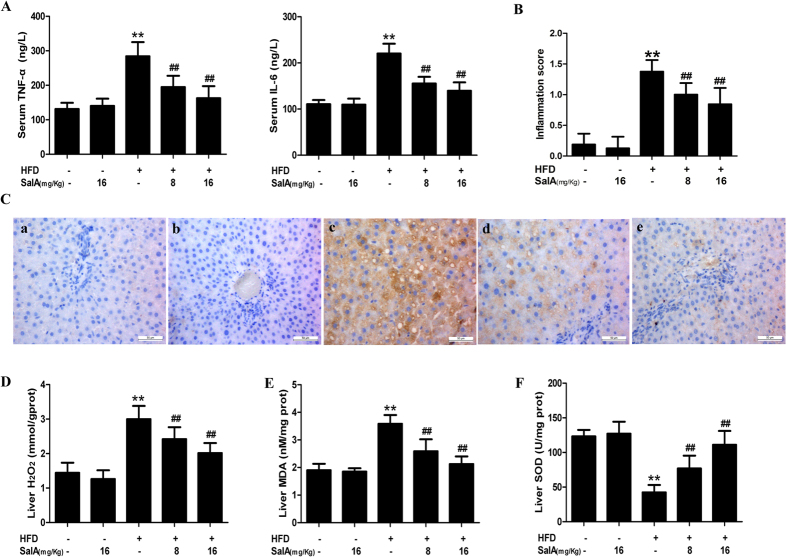
Figure 4. SalA protects rats against HFD-induced oxidative stress and inflammation.
(A) ELISA-based quantification of serum levels of TNF-α and IL-6. (B) Histopathological assessment of the hepatic inflammation score is presented for the following experimental groups: ND; ND + SalA (16 mg/kg); HFD; HFD + SalA (8 mg/kg) and HFD + SalA (16 mg/kg). The data are expressed as the mean ± SD (n = 8). **P < 0.01 vs. the control group; ##P < 0.01 vs. the HFD group. (C) Representative F4/80-stained sections of rat livers (400×). (A) ND group; (B) ND + SalA (16 mg/Kg) group; (C) HFD group; (D) HFD + SalA (8 mg/Kg) group; (E) HFD + SalA (16 mg/Kg) group. (D–F) Liver H2O2, MDA and SOD levels. The results are presented as the mean ± SD (n = 8), **P < 0.01 vs. the control group; ##P < 0.01 vs. the HFD group.

