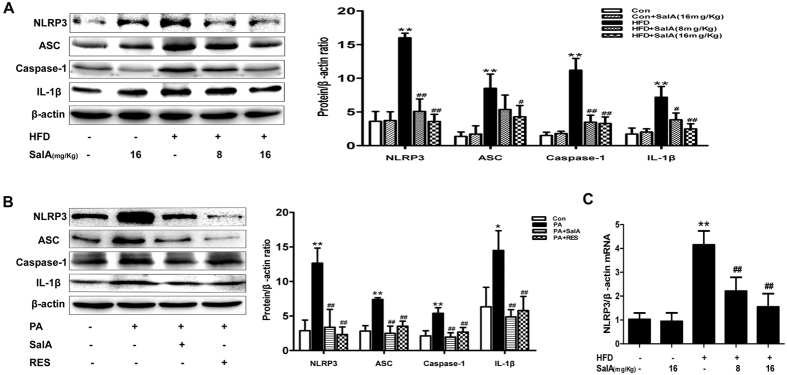
Figure 6. SalA inhibits NLRP3 inflammasome activation in HFD-fed rat livers and PA-treated HepG2 cells.
(A,B) The protein levels of NLRP3, ASC, caspase-1 and IL-1β in hepatic and cellular lysates were analyzed by Western blotting in different groups, as indicated (n = 3). (C) Hepatic mRNA levels of NLRP3 were analyzed by RT-PCR (n = 4). Results are presented as the mean ± SD, *P < 0.05, **P < 0.01 vs. the control group; #P < 0.05, ##P < 0.01 vs. the HFD group or the PA-treated group.

