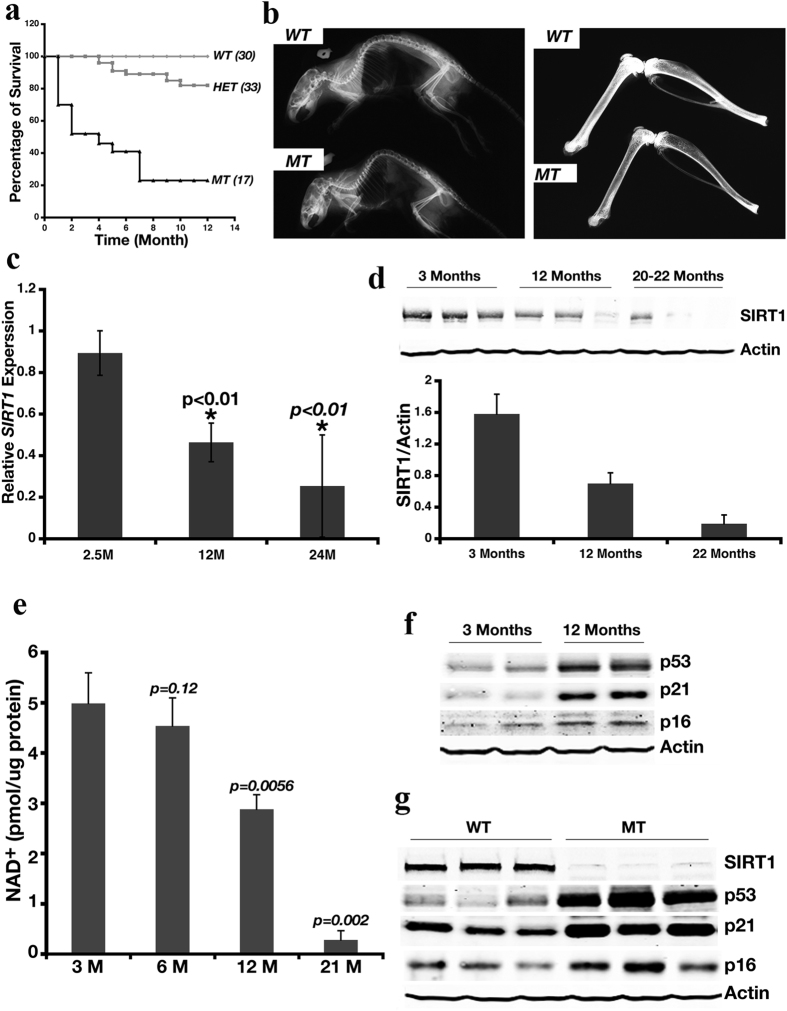
Figure 1. Deletion of Sirt1 Leads to Premature Aging.
(a) Kaplan-Meier curve for Survival of cohorts of wild-type (WT, n = 30), Sirt1 heterozygous (HET, n = 33), and Sirt1-deficient mice (MT, n = 17). Among 17 MT mice, there were 7 females. Of 7 females, 1 died at 5 months, 2 died at 7 months and 4 dies at 9–12 months of age. (b) Sirt1-deficient mice display kyphosis (left panel) and decreased bone density (right panel). X-ray photos are representative of those obtained for 5 WT and MT mice analyzed. (c) qRT-PCR analysis of Sirt1 expression in livers of WT mice at different ages. Data represent the mean (± standard deviation [SD], n = 6). **p < 0.01 represents the comparison between 12 months vs 2.5 months and 19 months vs. 2.5 months respectively. The expression level of Sirt1 in 2.5 months is set to 1. (d) Western blot analysis of Sirt1 protein in WT mice at different ages. Top panel, representative Western blot data; lower panel, quantitated Western blot data normalized to actin levels, mean (±SD, n = 6). (e) Mean NAD+ level (±SD, n = 5) in WT and MT mice at different ages. p-value obtained from the comparison between 3-month-old WT mice vs. all other groups of mice. (f,g) Western blot analysis of aging markers p53, p21, and p16 in WT mice at different ages (f) or in WT and MT mice at 3 months of age (g). Each group contained 5 mice; 2 mice from each time point are shown in (f) and 3 mice from each genotype are shown in (g).

