
FIG 4.
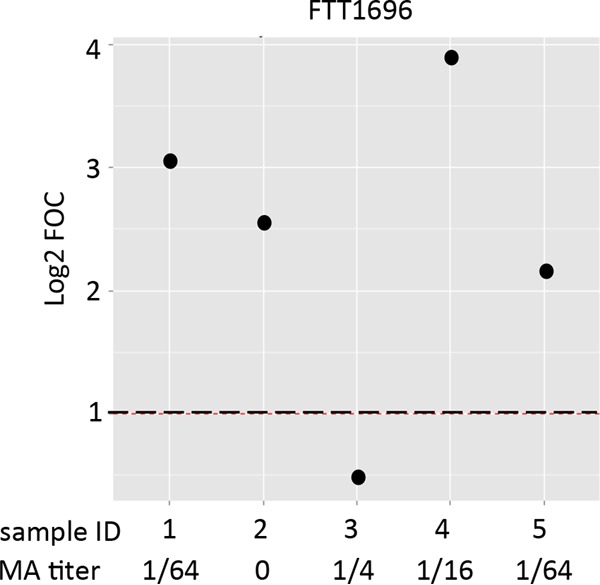
Relative sensitivity of MA titer and GroEL (FTT1696) on the protein array for detection of tularemia in 5 culture-confirmed tularemia cases. Sera from 5 culture-confirmed Spanish tularemia cases (group 6) were assayed by MA and on the protein microarrays for reactivity to the GroEL (FTT1696) antigen. MA titers are shown beneath the plot of the array values (cutoff, ≥1/64). The GroEL antigen was identified in Fig. 3 to discriminate Spanish tularemia cases and controls. Array data were normalized by dividing the IVTT reaction protein spot intensity by the sample-specific median for the 77 IVTT reaction control spots printed throughout the chip to give the FOC and then taking the base 2 logarithm of the ratio (log2 FOC). Dashed line, log2 FOC of 1 (2-fold over the background intensity) for the array.