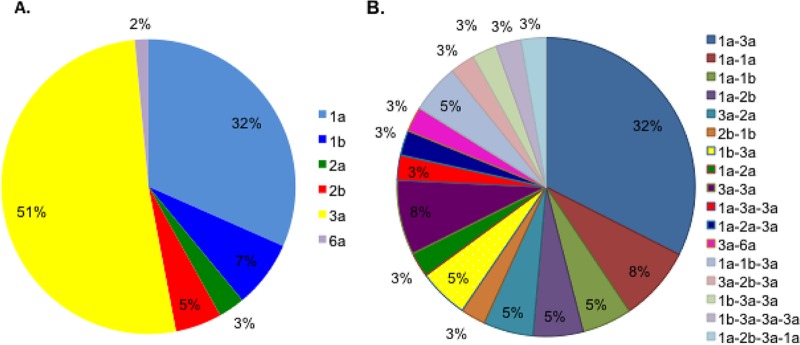
FIG 1.
Distribution of HCV subtypes and multiple-infection combinations. (A) Distribution of subtypes in the primary incident HCV infection samples in the cohort, with different subtypes represented by different colors as shown in the key. (B) A varied set of multiple-infection combinations were observed. Each multiple-infection combination is represented by a different color as shown in the key, with the percentage of each set as a proportion of the total also represented.

