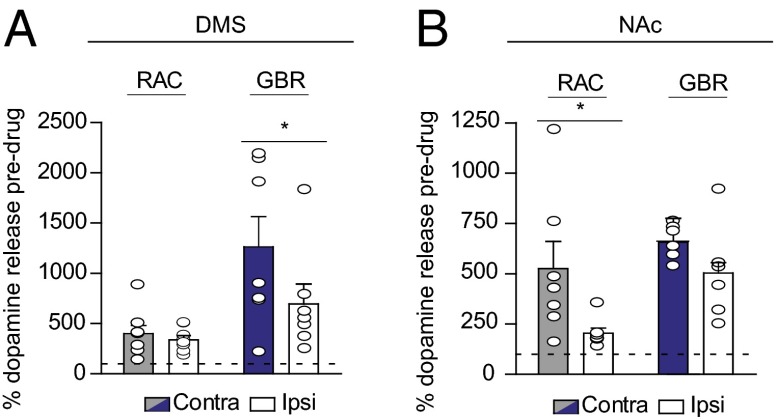
Fig. 4.
Contralateral dopamine release is differentially regulated in the DMS (A) and the NAc (B). The graphs show the average increase in contralaterally (gray/blue) or ipsilaterally (white) evoked dopamine after RAC and GBR administration as a percentage of baseline value. n = 6–8 animals per group. Data are average ± SEM with individual experiments overlaid. *P < 0.05, ANOVA with Bonferroni post hoc correction.

