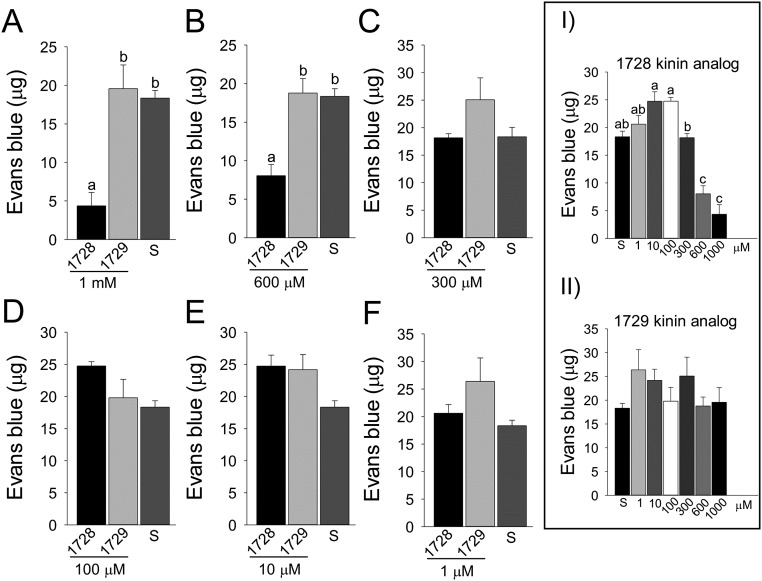
Fig. S3.
Volume of Evans blue (expressed in micrograms) found in females exposed to kinin analogs in sucrose solution with Evans blue in no-choice feeding assays. After 5 h of dietary exposure to analogs at different concentrations or to control sucrose solution (S), the amount of Evans blue was measured from pooled females in each treatment. Three biological replicates were done per treatment. (A–F) Analogs 1728 and 1729 are compared at the same concentrations. (Inset I) Females exposed to 600 and 1,000 µM of analog 1728 contained significantly less dye (P < 0.01). (Inset II) Analog 1729 did not have any effect on the residual amount of Evans blue, which at all analog concentrations was similar to that in mosquitoes exposed to the sucrose control. The data from three independent replications in each panel were analyzed with one-way ANOVA followed by Tukey's HSD test. In A and B, bars represent mean ± SEM. Common letters indicate nonsignificant differences at P < 0.05. (C–F). No significant differences were found among diets. (Insets) The data in A–F were analyzed with one-way ANOVA followed by Tukey's HSD test but comparing the different concentrations of the same analog. Bars represent the mean ± SEM. (Inset I). A common letter indicates no significant difference; P < 0.05. (Inset II) No significant difference was observed. One-way ANOVA was performed after an initial univariate GLM analysis demonstrated there was a significant effect of analogs and their concentrations that influenced Evans blue content (P < 0.0001).

