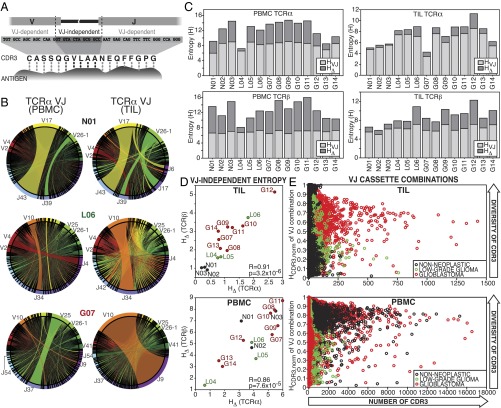
Fig. 2.
Entropy-based dissection of TCR diversity. (A) The components of the Shannon entropy of a single CDR3 sequence are displayed, reflecting the VJ-dependent (light gray) and VJ-independent (dark gray) origins of the information given by each residue, including the addition of random nucleotides upon the joining of cassettes and the replacement of some cassette-encoded nucleotides with random bases (dashed lines). Although all amino acids in the CDR3 motif participate in antigen binding (dotted connectors), some are determined entirely by V and J cassette sequence, whereas others are entirely independent. (B) The frequencies of VJ combinations in select PBMC (Left) and TIL (Right) TCRα repertoires are displayed in circular plots, with frequency of each V or J cassette represented by its arc length and that of the VJ cassette combination by the width of the joining ribbon. (C) The entropy of the clonotype repertoire (Hclonotype) for the PBMC (Left) and TIL (Right) of each patient (x axis) is displayed as the sum of the entropy of the VJ repertoire (HVJ, light gray) and the VJ-independent entropy (HΔ, dark gray). (D) For each patient, the VJ-independent entropy (HΔ) of the TIL (Top) and PBMC (Bottom) repertoires were calculated, as well as the Pearson correlations between TCRα (x axis) and TCRβ (y axis) across patients (PBMC R = 0.86, P = 7.6 × 10⁻⁵; TIL R = 0.92, P = 3.2 × 10⁻⁶). Label colors indicate clinical status (GBM, red; LGG, green; and nonneoplastic, black). (E) To illustrate relationship between the VJ-independent entropy of the clonotype repertoire and the CDR3 amino acid diversity of each VJ cassette combination, these combinations were plotted for each patient according to the number of CDR3 motifs encoded (x axis) and the normalized Shannon entropy of those CDR3 (y axis), with colors of each VJ cassette combination indicating clinical status of the patient (GBM, red; LGG, green; and nonneoplastic, black; TCRα and TCRβ are displayed together).

