Fig. 5.
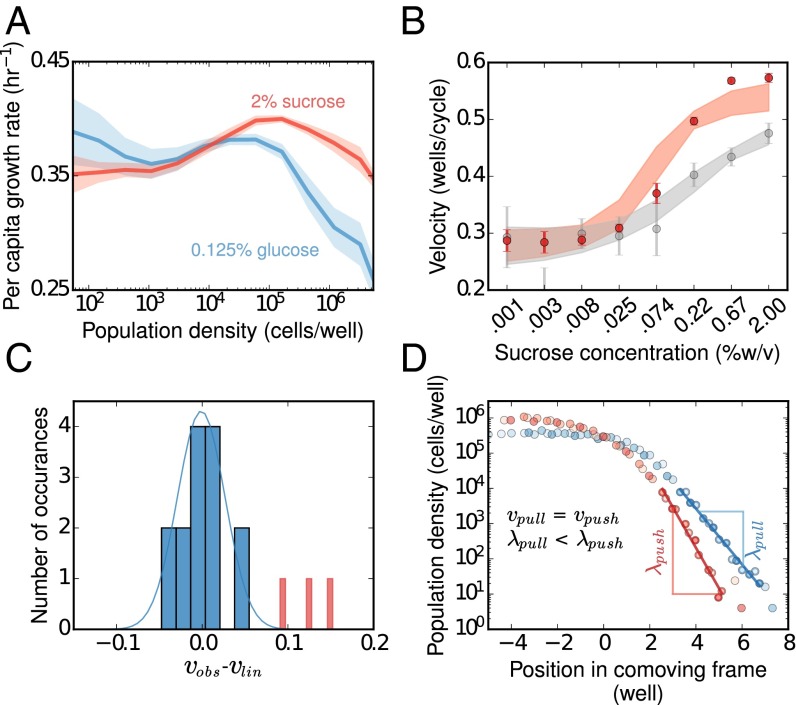
Populations expand as pulled waves when Allee effect is small, but a large Allee effect makes populations expand faster than predicted based on linearized growth. (A) Experimental measurement of growth rates in sucrose (red) and glucose (blue). The growth rate in glucose decreases monotonically with increasing population density, and thus exhibits no Allee effect. In contrast, the per capita growth rate in sucrose increases with population density (between 103 and 105 cells per well) and thus exhibits a weak Allee effect. (B) By adding sucrose to the growth media, we increased the strength of the Allee effect (SI Appendix, Fig. S6) and observed a transition from pulled to pushed waves. Below sucrose concentration of 0.025%, observed expansion velocities (red dots) matched pulled-wave predictions based on linearized-growth (gray dots). For higher sucrose concentrations, we observed a significant deviation in observed velocities from the linearized growth velocities, indicating that expansions had become pushed. The error bars on the measured velocity (red points) are SD. Error bars are obtained on the linearized growth velocities (in gray) by bootstrapping on the growth rate measurements at low density. The observed velocities match well with the predictions of a mechanistic model (SI Appendix, section 4) shown in red shading. The model also captures the transition from pulled to pushed waves as the deviation between observed and linearized-growth velocities (gray shading) around sucrose concentration of 0.025%. The width of the shaded regions is the SD of simulation results for 89 parameter sets obtained by bootstrapping over the growth rate measurements and fitting the model to it. (C) The data at low sucrose concentrations (0.001, 0.003, and 0.008%; pulled regime) in blue and high sucrose concentrations (0.22, 0.67, and 2.0%; pushed regime) in red demonstrates the statistical significance of our results. When the Allee effect is small the difference in observed and linearized growth velocities is indistinguishable from zero, but the difference is large and highly significant for a large Allee effect (P = 0.0015). (D) Pushed waves are expected to have steeper profiles than pulled waves when expanding at the same velocity (and with the same migration rate). We found that a pulled wave in 0.125% glucose (blue) and a pushed wave in 2% sucrose (red) have approximately equal velocities, and, as expected, population densities declined much faster in space for the pushed wave.

