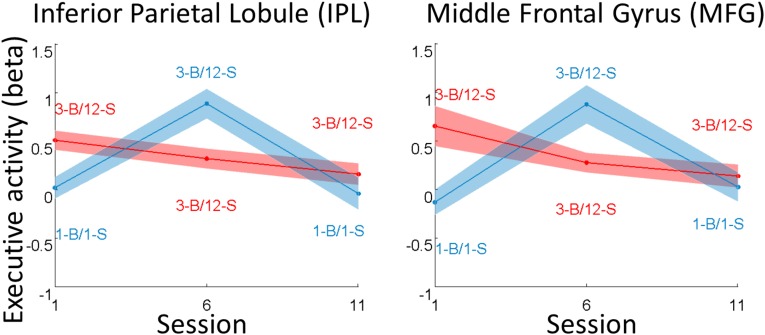
Fig. S5.
Variations of task-related activity across sessions. Graphs show means and intersubject SEs of regression estimates (β) extracted from the ROIs, which were obtained from group-level activations shown in Fig. 3. Regression estimates correspond to neural activity observed during executive tasks with respect to the baseline. Red curves correspond to the group that performed hard versions of executive tasks throughout the experiment. Blue curves correspond to the leisure group, which performed easy tasks in the first and last sessions, hard tasks in the intermediate session, and played video games or read between fMRI sessions. When the first and last sessions are compared, the only significant difference was observed in the MFG (for the hard condition).

