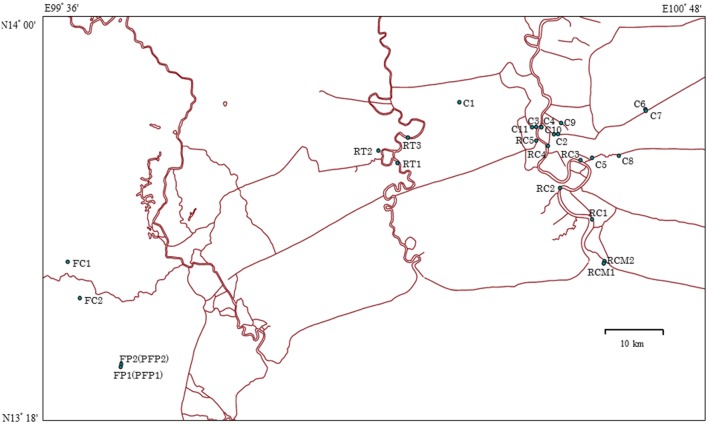
FIGURE 1.
Map of sampling sites in Thailand. RC 1–5 indicate Chao Phraya River sites; RCM 1 and 2 indicate sites at the mouth of Chao Phraya River; RT 1–3 indicate Ta Chin River sites; C 1–5 indicate the city canal sites sampled in 2013; C 6–11 indicate the city canal sites sampled in 2014; FC 1 and 2 and FP 1 and 2 indicate chicken and pig farm sites, respectively. Sources: http://www.savgis.org/cv_EN.htm.

