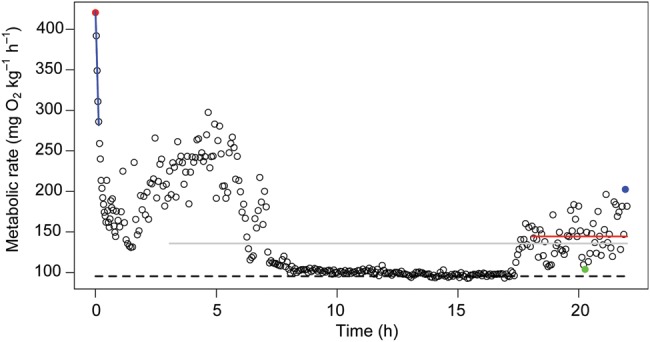
Figure 1:

Metabolic Q12 rate (; in milligrams of oxygen per kilogram per hour) over time (in hours) in European perch (Perca fluviatilis) measured using intermittent flow respirometry. A chase protocol was applied to elicit maximal metabolic rate (MMR; red datum), followed by declining values. A linear regression line was fitted to the first five data points recorded immediately after the chase protocol (blue line), and the slope was used to estimate the rate of recovery. Standard metabolic rate (SMR) was estimated as the average of the lowest 10th percentile of all measurements throughout the period of data collection (22 h; dashed line). After 3 h of acclimation, the average was recorded over 19 h (grey line). Routine was recorded as the mean during the last 4 h of respirometer confinement (red line). Likewise, the spontaneous minimal (green datum) and maximal (blue datum) values were measured during the last 4 h of respirometer confinement. Aerobic metabolic scope (AMS) was estimated as the difference between MMR and SMR (i.e. red datum and dashed line), whereas spontaneous aerobic metabolic scope (in milligrams of oxygen per kilogram per hour) was estimated as the difference between the spontaneous minimal and maximal (i.e. between the green and blue data points).
