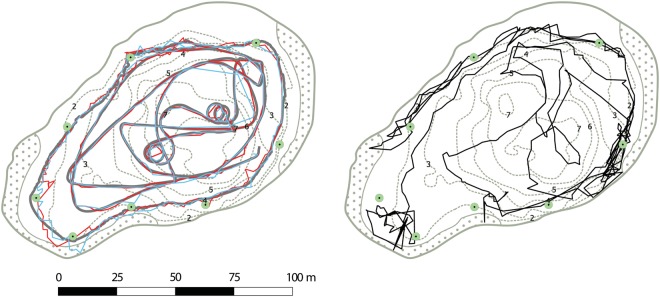
Figure 2:
Overview of study lake, telemetry system and example data from test tracks (left) and a 24 h track from a single fish used in the study (right). Green circles indicate positions of the eight hydrophones; dotted areas show the extent of emergent macrophytes (Tyhpa latifolia); and dotted lines are depth isopleths, with depth given in metres. Transmitters surgically implanted in the fish emit acoustic signals. When these signals are detected on more than three hydrophones, a position can be calculated using hyperbolic multilateration based on time differences of arrival on each hydrophone (see Baktoft et al. 2015 and references therein for further details). Test tracks (left) were obtained by moving two transmitters (blue and red lines) attached to a vertical rod mounted on a boat. True trajectory of the test track (thick grey line) was obtained by a hand-held differential GPS unit held directly above the transmitters.

