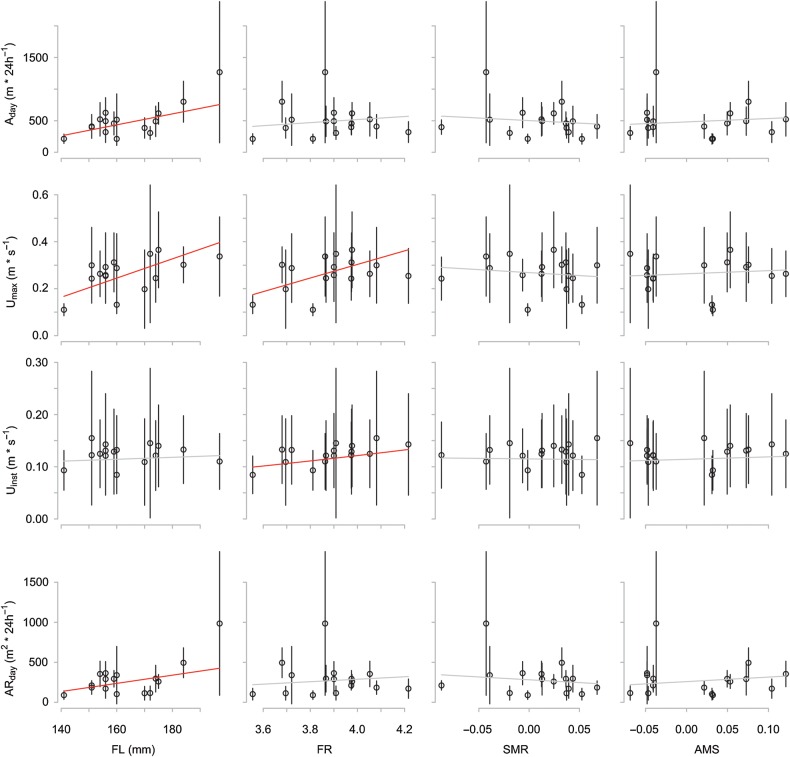
Figure 3:
Visualization of raw data (mean values ± SD) and regression lines obtained from the random intercept linear mixed effects models. Significant regression lines (P < 0.05) are shown in red; non-significant in grey. Fork length (FL) and fineness ratio (FR) correlated positively with one or more of the activity measures. None of the metabolic measures [standard metabolic rate (SMR), maximum metabolic rate (MMR), aerobic metabolic scope (AMS), PCA axes representing other metabolic metrics (MET1–3)] was found to explain a significant amount of variation (Table 2; only SMR and AMS are shown in the figure). Metabolic measures were estimated by respirometry and corrected for body mass variation using analysis of residuals when appropriate.

