
Figure 2. miRNA-mRNA regulatory networks in stomach metaplasias.
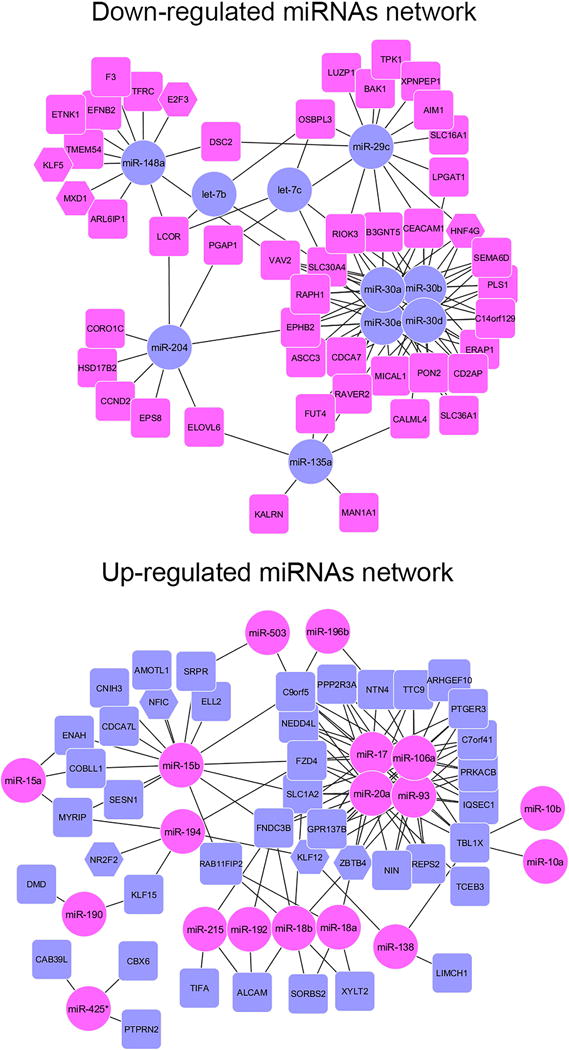
The software MAGIA2 was used to compare our miRNA expression data with a previous mRNA data obtained from the same patient samples14 TargetScan and Diana micro-T miRNA were used for target prediction in combination with a direct integration of our miRNA and a previous mRNA expression data using a non-parametric measurement (Spearman) of the correlation indexes. The top 250 interactions (negative correlation >0.650) were used to construct an interaction network using Cytoscape 3.0. In A-C, Magenta circles represent miRNAs upregulated in the metaplasias, whereas blue rectangles or hexagons (for transcription factors) represent protein-coding mRNAs down-regulated in metaplasia. Comparisons are shown for A. miRNAs up-regulated significantly in SPEM only, B. miRNAs significantly up-regulated in SPEM and intestinal metaplasia (IM) and C. miRNAs up-regulated in intestinal metaplasia. D. depicts miRNAs down-regulated in intestinal metaplasia with Blue circles representing miRNAs down-regulated in the IM, whereas magenta rectangles or hexagons (for transcription factors) represent protein-coding mRNAs upregulated in metaplasia.14