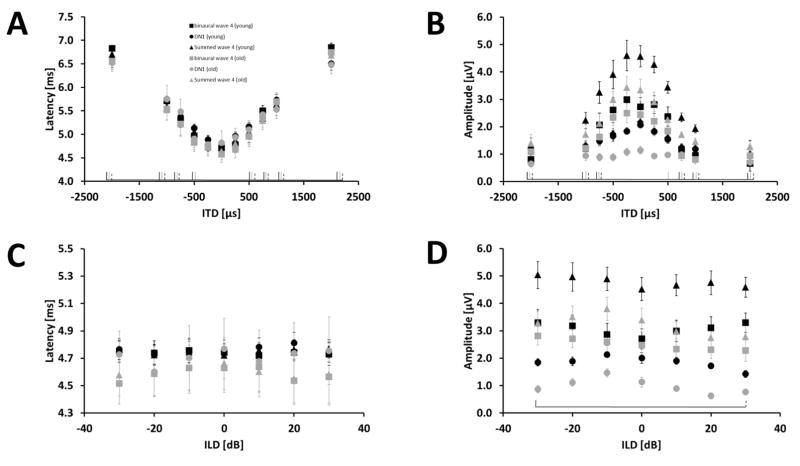
Figure 4.
Effects of ITD and ILD and age on the latency and amplitude on wave 4 in the binaural ABR and summed monaural ABRs as well as the DN1 component at a stimulus intensity of 90 dB pSPL. Results for wave 4 in the binaural ABR are indicated by squares and in the summed monaural ABR by triangles. Results for the DN1 component are indicated by circles. The different age groups are represented by black and grey for young and old gerbils, respectively. At the bottom of each subplot, significant differences to ITD of 0 μs or ILD of 0 dB are indicated by black solid lines for binaural-evoked wave 4, with grey solid lines for wave 4 in the summed monaural ABRs and with black dashed lines for the DN1 component. (A) Latency in ms (± S.E.M) for different ITDs in μs. (B) Amplitude in μV (± S.E.M) for different ITDs in μs. (C) Latency in ms (± S.E.M) for different ILDs in dB SPL. (D) Amplitude in μV (± S.E.M) for different ILDs in dB SPL. Sample size: ITD: Young: 9 animals for 0,± 500, ± 1000, ± 2000; 8 animals for ± 250, ± 750. Old: 9 animals. ILD: Young and Old: 9 animals.

