
Figure 5.
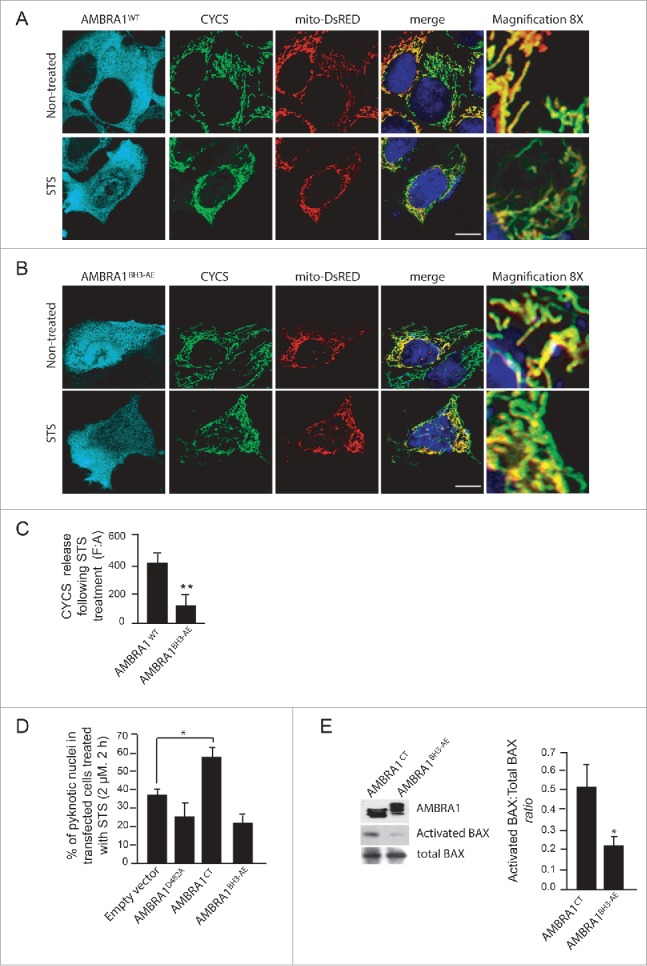
The mutant of AMBRA1 that cannot bind BCL2 loses its proapoptotic effect during cell death. (A) HEK293 cells were cotransfected with a vector encoding AMBRA1WT or (B) AMBRA1BH3-AE and mito-DsRED (in order to stain mitochondria). Twenty-four h after transfection, cells were treated with or without STS (2 µM) for 4 h. Cells were fixed and then stained using the anti-CYCS (green) antibody. Nuclei were stained with DAPI 1µg/µl 20 min. The merging of the different fluorescence signals is illustrated. Scale bar: 8 µm. (C) HEK293 cells were transfected with an empty vector or with a vector encoding AMBRA1D482A, AMBRA1CT (see Fig. 3D) or with a vector encoding AMBRA1BH3-AE. Twenty-four h following transfection, cells were treated with 2 µM STS during 3 h. Cells were next fixed and examined by immunolabelling using anti-AMBRA1 antibody that recognizes only the overexpressed form of the protein and cells with condensed or fragmented nuclei were scored as pyknotic. Results are expressed as the percentage of transfected cells displaying pyknotic nuclei. For each condition, transfected cells were counted in 10 random fields from 3 independent experiments. Values are given as a percentage (± SD) of cell death. (D) Graphic of densitometric values of CYCS release, expressed as mean fluorescence of individual cells, normalized to total cellular surface (F:A, n=30 cells/groups). (E) HEK293 cells transfected with a vector encoding AMBRA1CT or AMBRA1BH3-AE were analyzed by western blot using antibodies against activated BAX and total BAX. The band density ratio of activated BAX/total BAX was analyzed in 3 independent experiments; each point value represents the mean ± SD from 3 independent experiments. Statistical analysis was performed using the Student t test (*P < 0.05).