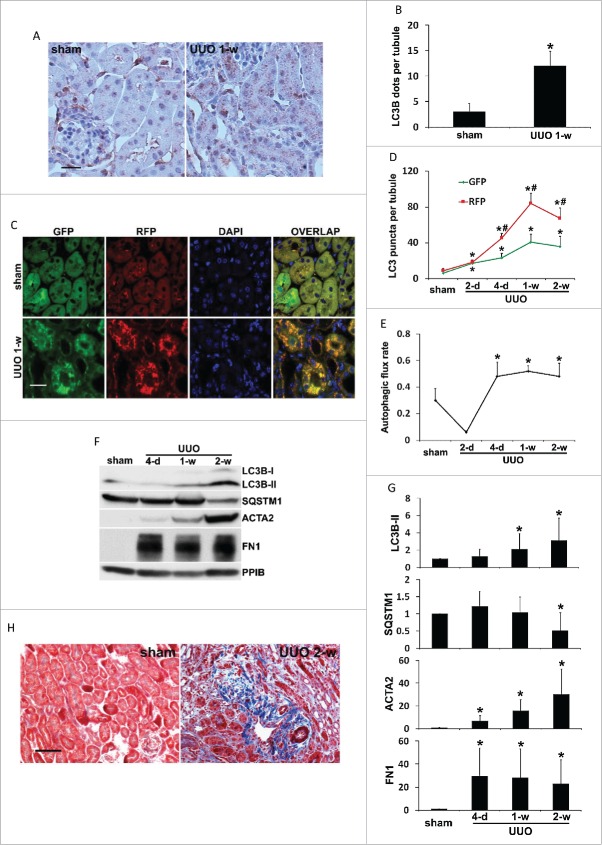
Figure 1.
Autophagy is persistently induced in renal proximal tubules during UUO. C57Bl/6 (A, B, F, G and H) or CAG-RFP-GFP-LC3 (C, D and E) mice were subjected to either sham operation or UUO surgery. The mice were sacrificed at the indicated time points (2 days, 4 d, 1 wk and 2 wk) and left kidneys were collected for histological and immunoblot analyses. (A) Representative images of immunohistochemical staining of LC3B. Occasionally, there was LC3B-positive staining in nuclei; however, no LC3B-positive staining was observed in either sham control or UUO kidney tissues in the absence of primary antibody (data not shown), suggesting the specificity of this LC3B staining. Scale bar: 20 µm. (B) Quantitative analysis of punctate LC3B staining. Data are expressed as mean ± SD. *, P < 0.05, significantly different from the sham group. (C) Representative images of GFP-LC3 and RFP-LC3 fluorescence staining. Scale bar: 15 µm. (D) Quantitative analysis of GFP-LC3 and RFP-LC3 puncta. Data are expressed as mean ± SD. *, P < 0.05, significantly different from the sham group; #, P < 0.05, values of RFP-LC3 puncta significantly different from the relevant values of GFP-LC3 puncta. (E) Analysis of autophagic flux rate. Data are expressed as mean ± SD. *, P < 0.05, significantly different from the sham group. (F) Representative images of immunoblot analysis of LC3B, SQSTM1, ACTA2, and FN1. PPIB was used as a loading control. (G) Densitometric analysis of LC3B, SQSTM1, ACTA2, and FN1 signals. After normalization with PPIB, the protein signal of the sham was arbitrarily set as 1, and the signals of other conditions were normalized with the sham control to calculate fold changes. Data are expressed as mean ± SD. *, P < 0.05, significantly different from the sham group. (H) Representative images of Masson trichrome staining. Scale bar: 50 µm.

