
Figure 3.
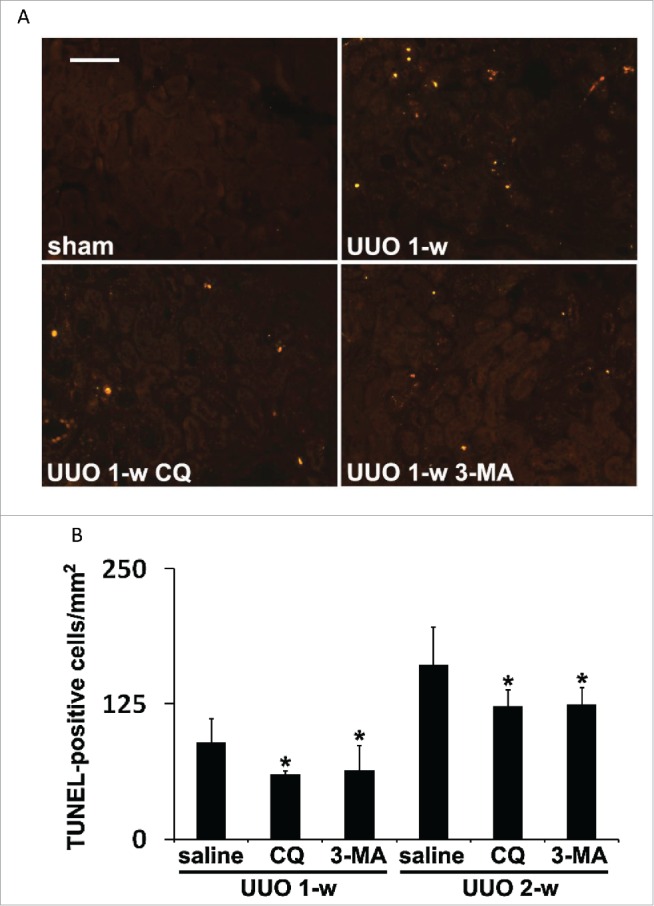
Pharmacological inhibition of autophagy attenuates tubular cell apoptosis induced during UUO. Animals and their treatment were the same as described in Figure 2. (A) Representative images of TUNEL staining. Scale bar: 50 µm. (B) Quantitative analysis of TUNEL staining. Data are expressed as mean ± SD. *, P < 0.05, significantly different from the UUO + saline group.