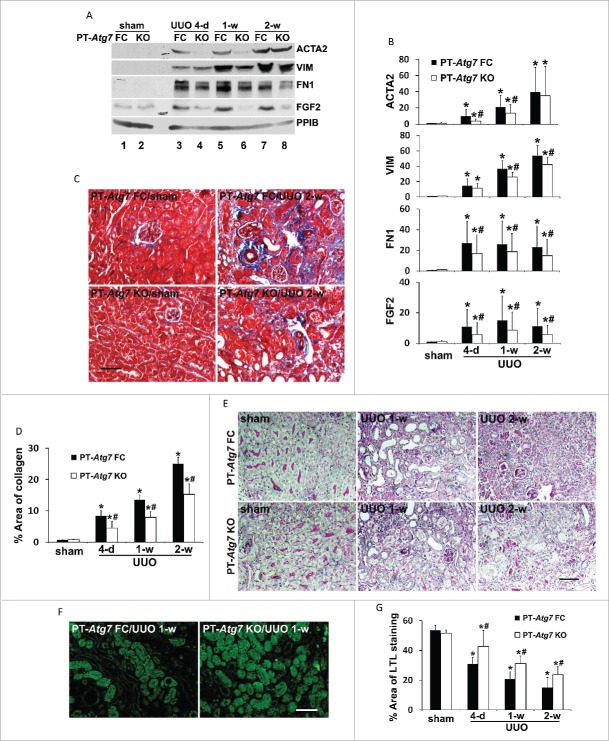
Figure 5.
Autophagy deficiency in PT-Atg7 knockout mice suppresses renal interstitial fibrosis, tubular atrophy and nephron loss during UUO. Animals and their treatment were the same as described in Fig. 4. (A) Representative images of immunoblot analysis of ACTA2, VIM, FN1, and FGF2. PPIB was used as a loading control. (B) Densitometric analysis of ACTA2, VIM, FN1, and FGF2 signals. After normalization with PPIB, the protein signal of PT-Atg7 FC sham was arbitrarily set as 1, and the signals of other conditions were normalized with PT-Atg7 FC sham to calculate fold changes. Data are expressed as mean ± SD. *, P < 0.05, significantly different from PT-Atg7 FC sham group; #, P < 0.05, significantly different from the relevant PT-Atg7 FC group. (C) Representative images of Masson trichrome staining. Scale bar: 50 µm. (D) Quantitative analysis of Masson trichrome staining. Data are expressed as mean ± SD. *, P < 0.05, significantly different from PT-Atg7 FC sham group; #, P < 0.05, significantly different from the relevant PT-Atg7 FC group. (E) Representative images of PAS staining. Scale bar: 50 µm. (F) Representative images of LTL staining. Scale bar: 50 µm. (G) Quantitative analysis of LTL staining. Data are expressed as mean ± SD. *, P < 0.05, significantly different from PT-Atg7 FC sham group; #, P < 0.05, significantly different from the relevant PT-Atg7 FC group.

