
Figure 8.
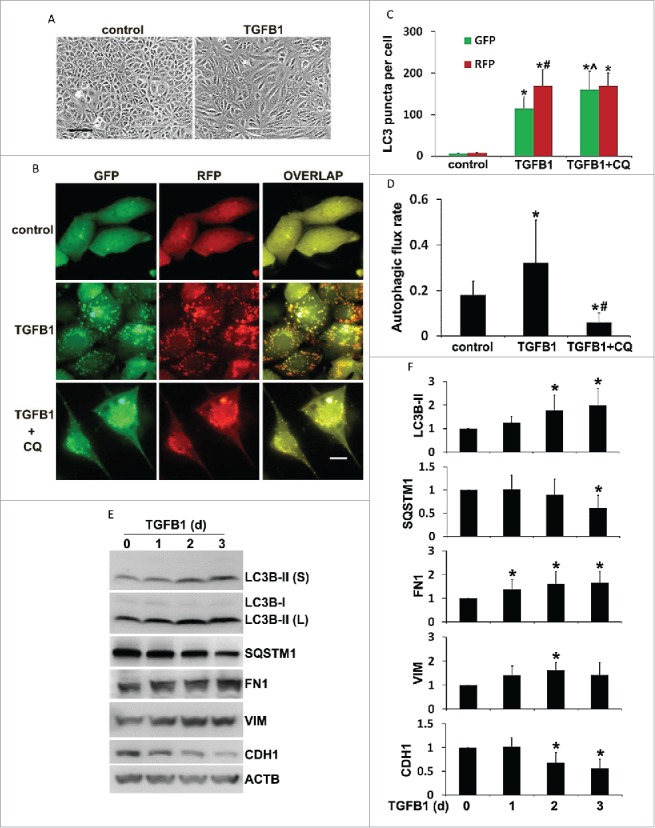
Autophagy is induced by TGFB1 in BUMPT mouse proximal tubular cell line along with profibrotic changes. BUMPT cells were untreated (d 0) or treated with 5 ng/ml TGFB1 for 1 to 3 d. In some experiments BUMPT cells were transiently transfected with mRFP-GFP-LC3 and then untreated (control) or treated with 5 ng/ml TGFB1 in the absence or presence of 20 μM chloroquine (CQ). After treatment the cells were collected for morphological and immunoblot analyses. (A) Representative images of phase contrast showing cell morphology. Scale bar: 50 µm. (B) Representative images of fluorescence microscopy showing GFP-LC3 and mRFP-LC3 puncta in cells. Scale bar: 15 µm. (C) Quantitative analysis of GFP-LC3 and mRFP-LC3 puncta. Data are expressed as mean ± SD. *, P < 0.05, significantly different from the relevant control group; ˆ, P < 0.05, significantly different from the TGFB1 group. #, P < 0.05, significantly different from GFP-LC3 puncta counting. (D) Analysis of autophagic flux rate. Data are expressed as mean ± SD. *, P < 0.05, significantly different from the control group; #, P < 0.05, significantly different from the TGFB1 group. (E) Representative images of immunoblot analysis of LC3B, SQSTM1, FN1, VIM, and CDH1. ACTB was used as a loading control. (F) Densitometric analysis of LC3B, SQSTM1, FN1, VIM, and CDH1 signals. After normalization with ACTB, the protein signal of control (day 0) was arbitrarily set as 1, and the signals of other conditions were normalized with control to calculate fold changes. Data are expressed as mean ± SD. *, P < 0.05, significantly different from control group.