
Figure 9.
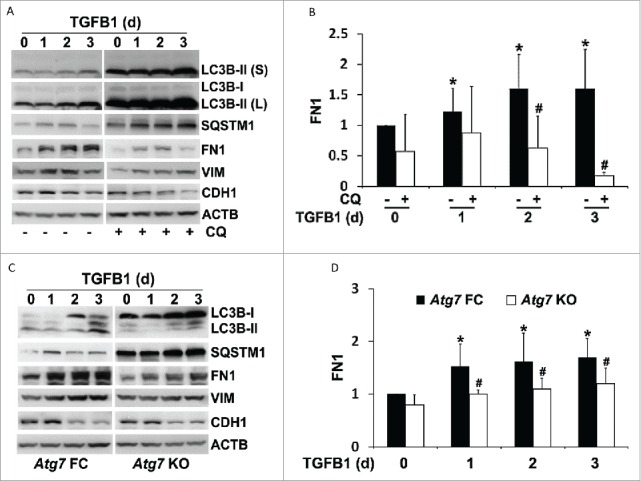
Inhibition of autophagy suppresses FN1 accumulation in TGFB1-treated proximal tubular cells without affecting phenotypic transition. (A) BUMPT cell were untreated (day 0) or treated with 5 ng/ml TGFB1 for 1 to 3 d in the absence (−) or presence (+) of 20 μM chloroquine (CQ). After treatment the cells were collected for immunoblot analysis of LC3B, SQSTM1, FN1, VIM, and CDH1. ACTB was used as a loading control. (B) Densitometric analysis of FN1 signals. After being normalized with ACTB, the protein signal of control (day 0, CQ -) was arbitrarily set as 1, and the signals of other conditions were normalized with control to calculate fold changes. Data are expressed as mean ± SD. *, P < 0.05, significantly different from control (day 0, CQ -) group; #, P < 0.05, significantly different from TGFB1 (CQ -) group. (C) Atg7 floxed control (FC) and KO proximal tubular cells were untreated (day 0) or treated with 5 ng/ml TGFB1 for 1 to 3 d. After treatment the cells were collected for immunoblot analysis of LC3B, SQSTM1, FN1, VIM, and CDH1. ACTB was used as a loading control. (D) Densitometric analysis of FN1 signals. After normalization with ACTB, the protein signal of Atg7 FC control (d 0) was arbitrarily set as 1, and the signals of other conditions were normalized with Atg7 FC control to calculate fold changes. Data are expressed as mean ± SD. *, P < 0.05, significantly different from Atg7 FC control group; #, P < 0.05, significantly different from the relevant Atg7 FC group.