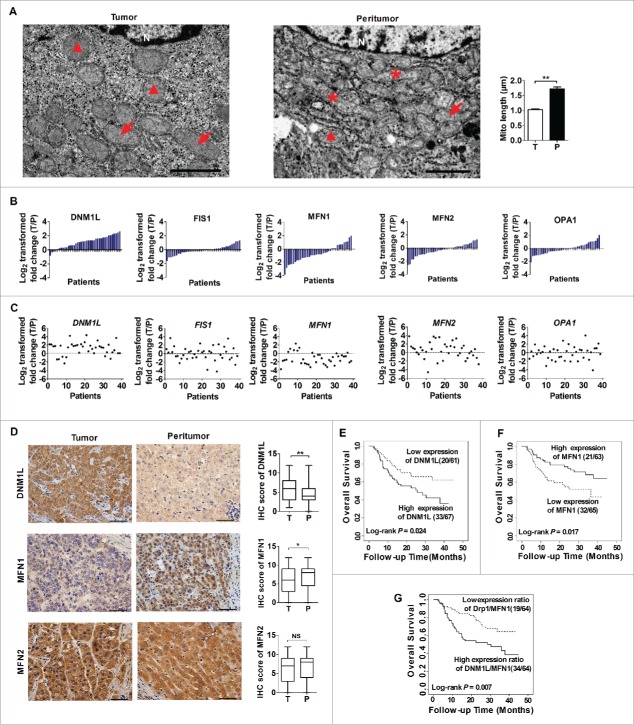
Figure 1.
Mitochondrial dynamics in HCC tissues and their effects on prognosis of HCC patients. (A) Representative transmission electron microscopy images of mitochondrial network in paired tissues from HCC patients (n=15). Asterisks, arrows and triangles indicate elongated, intermediate (mid) and fragmented mitochondria, respectively. N, nucleus. Scale bar: 2 µm. (B and C) Western blot and qRT–PCR analyses for expression levels of DNM1L, FIS1, MFN1, MFN2 and OPA1 in 39 paired tissues from HCC patients. T, tumor; P, peritumor. The relative expression ratio of tumor to peritumor was log2-transformed. The serial number of patient was rearranged for western blot according to expression level, while qRT-PCR data were displayed according to serial patient ID number. (D) Representative immunohistochemical (IHC) staining images of DNM1L, MFN1 and MFN2 in paired HCC tissues (n = 128). *, P<0.05; **, P<0.01. Scale bar: 50μm. (E to G) Kaplan-Meier curve analysis of overall survival in HCC patients by the expression of DNM1L and MFN1. Death/total and recurrence/total number of patients in each subgroup were presented.

