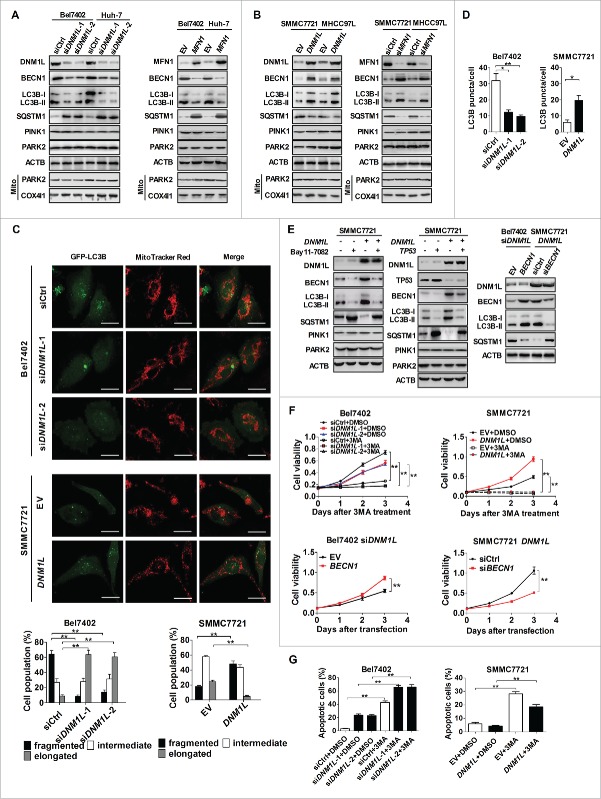
Figure 5.
Inhibition of apoptosis by increased mitochondrial fission is alternatively regulated by activation of autophagy. (A and B) Western blot analyses for total protein levels of DNM1L, MFN1, BECN1, LC3B-I/-II, SQSTM1, PINK1 and PARK2 in HCC cells with different treatments as indicated. Protein levels of PARK2 in mitochondria were examined by purifying mitochondria from HCC cells. COX4I1/COX IV were used as loading controls for mitochondria. (C) Representative images of fluorescent LC3B puncta (green) and mitochondria (red) in HCC cells with different treatment as indicated. Scale bar: 5 µm. (D) Numbers of GFP-LC3B puncta per cell were analyzed in HCC cells with treatment as indicated. (E) Western blot analyses for DNM1L, BECN1, LC3B-I/-II, SQSTM1, PINK1 and PARK2 in SMMC7721 cells transiently transfected with DNM1L expression vector and then followed by treatment with the NFKB inhibitor Bay11-7082 (left panel) and for DNM1L, TP53, BECN1, LC3B-I/-II, SQSTM1, PINK1 and PARK2 in those cells transiently tansfected with DNM1L and/or TP53 expression vectors (middle panel) as well as for DNM1L, BECN1, LC3B-I/-II and SQSTM1 in cells with DNM1L knockdown or overexpression, which were transiently tansfected with BECN1 siRNA or BECN1 expression vector (right panel) as indicated. (F) Cell viability was evaluated by MTS assay in HCC cells with different treatment as indicated. (G) Apoptosis analysis by flow cytometry in HCC cells with treatment as indicated.

