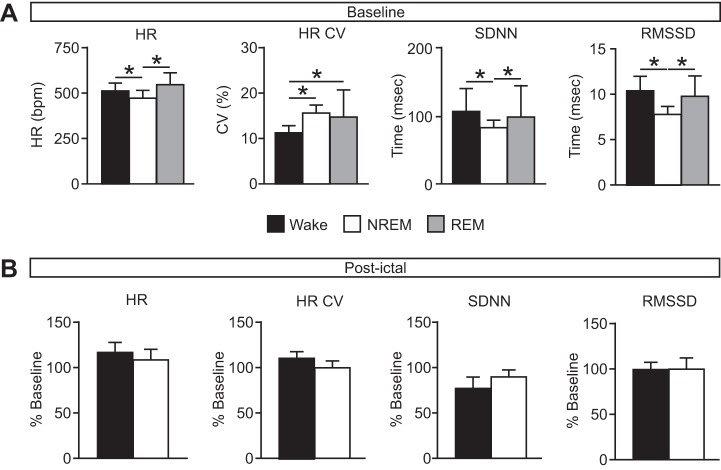
Fig. 4.
Minimal effect of seizures induced during different vigilance states on cardiac function. A: baseline heart rate (HR), coefficient of variance of the interheart-beat interval (HR CV), and heart rate variability (SDNN, RMSSD) during wake (black), NREM (white), and REM (gray). HR: wake (W), 508.17 ± 36.61 beats/min; NREM (N), 468.31 ± 37.50 beats/min; REM (R), 520.72 ± 64.67 beats/min; P = 0.272 for W compared with R; HR CV: W, 11.17 ± 1.43%; N, 15.48 ± 1.55%; R, 14.61 ± 5.69%; P = 0.326 for N compared with R; SDNN: W, 105.67 ± 33.23 ms; N, 81.97 ± 10.31 ms; R, 97.40 ± 46.69 ms; P = 0.310 for W compared with R; RMSSD: W, 10.39 ± 1.54 ms; N, 7.74 ± 0.77 ms; R, 9.70 ± 2.16 ms; P = 0.209 for W compared with R. *P < 0.05. n = 12 for each state. B: postictal cardiac measures (as in A) following seizures induced during wake (black) and NREM (white) presented as percentage of baseline. Raw postictal values as follows: HR: W, 588.48 ± 80.91 beats/min; N, 471.26 ± 76.37 beats/min; P = 0.059; HR CV: W, 12.32 ± 2.14%; N, 15.32 ± 2.31%; P = 0.159; SDNN: W, 80.71 ± 23.94 ms; N, 72.91 ± 15.43 ms; P = 0.273; RMSSD: W, 10.18 ± 2.32 ms; N, 7.27 ± 1.86 ms; P = 0.079. n = 6 for Wake; n = 4 for NREM. SDNN, standard deviation of R-R intervals; RMSSD, root mean square of the differences between consecutive R-R intervals.

