
Fig. 6.
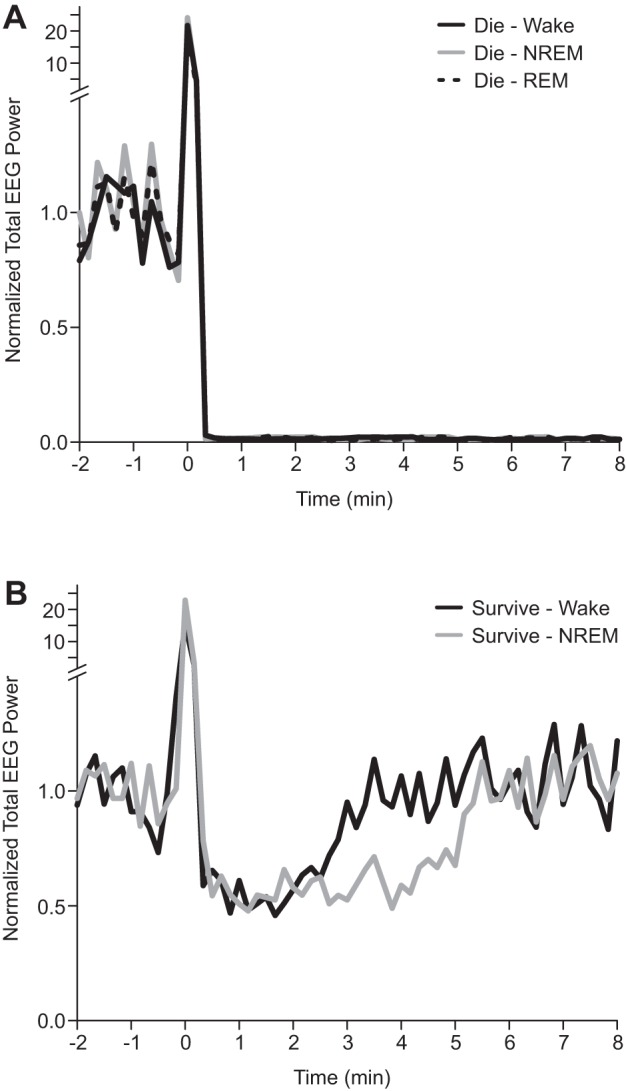
Prolonged suppression of electroencephalography (EEG) activity following nonfatal seizures induced during NREM sleep. Total EEG power between 0.5 and 20 Hz plotted vs. time relative to seizure onset (time 0) in 10 s epochs. Fast Fourier transform (FFT) power is plotted relative to 1 min of baseline EEG during wakefulness prior to seizure induction. Mean data are presented for mice that died (A) following seizures induced during wakefulness (black; n = 6), NREM (gray; n = 8), and REM (dotted; n = 12), and those that survived (B) following seizures induced during wakefulness (black; n = 6) and NREM (gray; n = 4).