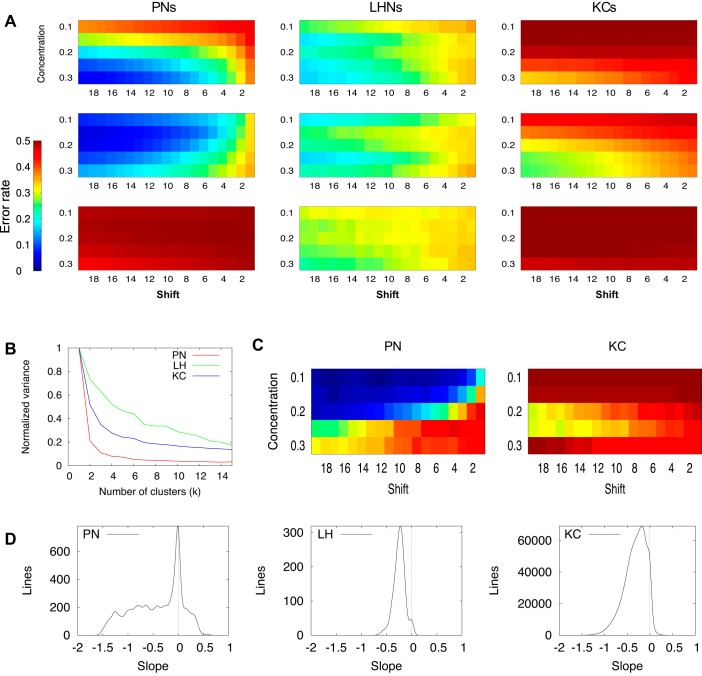
Fig. 3.
Classification performance by single neurons. A: average classification error rate profiles obtained by K-means clustering (k = 3): PNs (left), LHNs (middle), and KCs (right). X-axis is odor similarity (from low to high). Y-axis is odor concentration (0.1, low concentration; 0.3, high concentration). Color of the heat map is error rate with a maximum of 0.5 (chance level for 2 odors). B: total variance as a function of number of clusters used in decomposition. Variance was computed as the sum of distances between the cluster and all points belonging to that cluster (summed for all clusters). C: examples of two single-cell error rate profiles: PN (left), KC (right). D: distribution of the error rate vs. concentration slopes. For each odor pair, we computed the slope of line approximating error rate as a function of concentration (a slice of a particular color from error concentration profiles shown in A), giving 20 slopes per neuron. The distribution of all slopes for all cells is plotted in B. Cells with completely flat profile with error rate 0.5 were omitted from this analysis.

