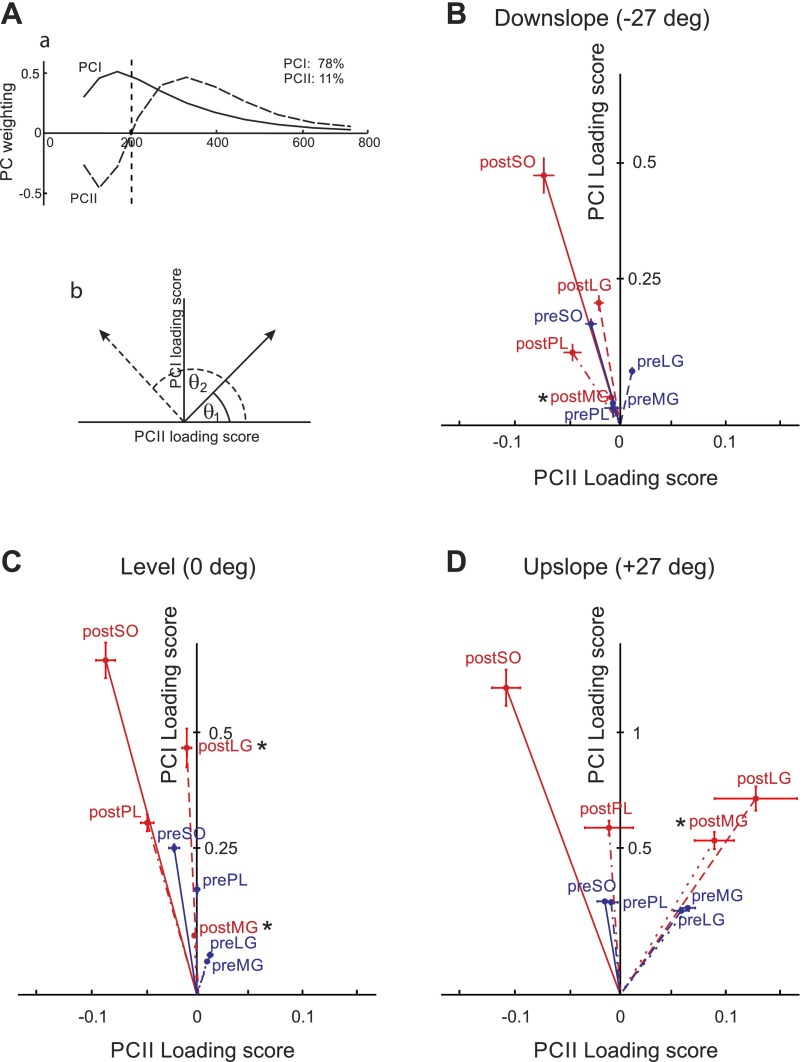
Fig. 8.
Results of principal component analysis on wavelet-transformed myoelectric signals. Aa: 1st 2 principal component weightings (PCI, solid line; PCII dashed line). The amount of the original myoelectric signal explained by each component is shown at top right. Ab: definition of angle theta (θ) that represents the angle between the PCI-PCII loading score vector and the PCII loading score axis. Larger θ values (θ2, dashed line) indicate relatively more low frequency signal content. B, C, and D: PCI-PCII loading score vector plots from whole stride data collected from intact soleus (preSO), lateral gastrocnemius (preLG), medial gastrocnemius (preMG), plantaris (prePL), and from the same muscles after self-reinnervation of soleus and lateral gastrocnemius: soleus (postSO), lateral gastrocnemius (postLG), medial gastrocnemius (postMG), and plantaris (postPL). Each point represents the mean ±SE loading score values for each condition: downslope walking (B: −50% or −27°), level walking (C: 0% or 0°), and upslope walking (D: +50% or +27°). Blue lines indicate vectors from the origin to pre-nerve transection points and red lines from the origin to points obtained post-self-reinnervation of SO and LG. Note that the y-axis scale for downslope and level walking conditions is different from Upslope condition. *Significant difference (P < 0.05) in angle θ compared with pre-nerve transection repair.

