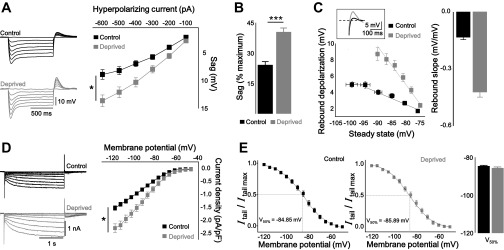
Fig. 3.
Activity deprivation resulted in enhanced hyperpolarization-activated current (Ih) activity. A: representative traces (left) and plots (right) showing that voltage sag was significantly increased in deprived neurons (gray) vs. control (black). B: bar graph of normalized sag voltage by maximal potential showing the increased voltage sag in deprived neurons. C: representative traces (inset), plot (bottom), and bar graph (right) showing relationship between rebound depolarization and steady-state voltage and calculated rebound slope from control and deprived. D: representative traces (left) and plots (right) showing that Ih density was increased in deprived neurons vs. control. E: representative plots (left) showing activation curve of Ih from control and deprived neurons. Tail current was normalized by maximal tail current amplitude and fitted by Boltzmann function. Bar graph (right) showing the half-maximal activation voltage of Ih in control and deprived neurons. Asterisks in A and D marked by 2-way repeated-measures ANOVA; *P < 0.05, ***P < 0.001.

