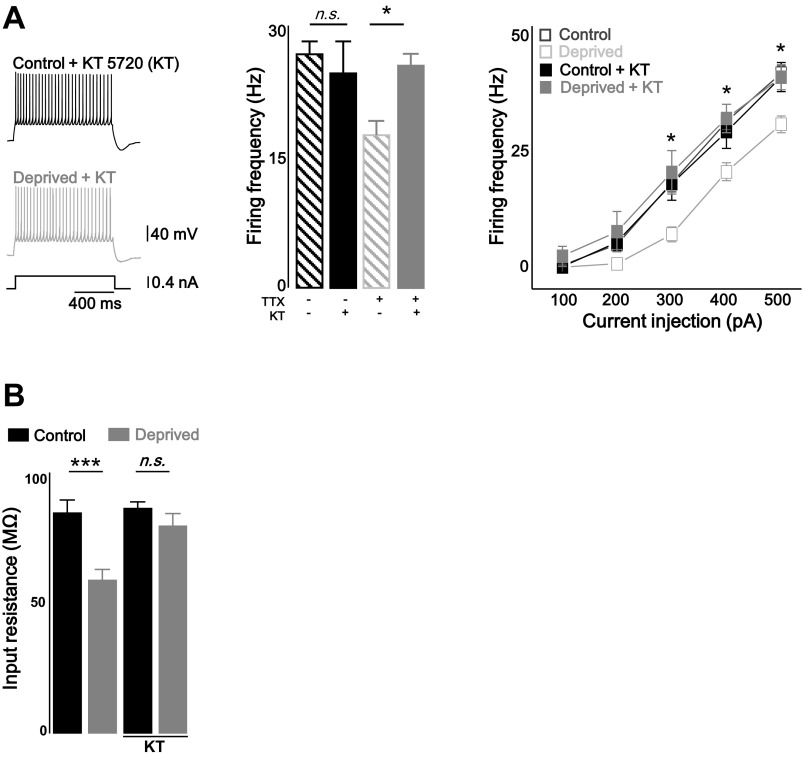
Fig. 6.
Homeostatic intrinsic plasticity was dependent on PKA pathway. A: representative traces (left) and bar graph (middle; at +400 pA injection) and plots (right) showing that treatment of PKA inhibitor KT 5720 (KT) prevented homeostatic intrinsic plasticity in cerebellar PCs. B: bar graph showing the reduced Rin was recovered by KT (500 nM). Closed black square, KT only; closed gray square, deprived + KT; open black square, control; open gray square, deprived. Control and deprived values are as described in Fig. 1. Asterisks in A marked by post hoc Tukey's test, pairwise comparison followed by 2-way repeated-measures ANOVA, compared with deprived and deprived + KT. Asterisks in B marked by 2-sample t-test; *P < 0.05, ***P < 0.001; n.s., no significance.

