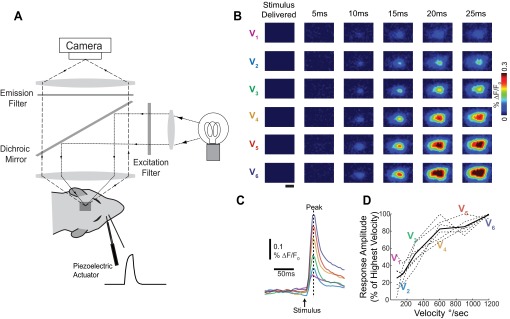
Fig. 1.
Trial-average cortical response amplitude was modulated by stimulus strength. A: a schematic of the voltage-sensitive dye (VSD) imaging system. A piezoelectric actuator delivered controlled mechanical deflections of a whisker with variable velocity. The surface of the cortex was stained with VSD, and images were recorded on a high-speed charge-coupled device camera every 5 ms. B: representative cortical responses to whisker deflections of variable velocity (V1, lowest). Images were averaged over 60 trials. Scale bar (1 mm) applies to all images. %ΔF/F0, response amplitude. C: corresponding time series to the images shown in B. Time series were calculated by averaging over a circular region of interest the size of 1 cortical column (∼400-μm diameter) centered over the barrel corresponding to the deflected whisker. The peak response frame determines the response amplitude. D: the trial-average response amplitude for each data set (dashed lines, n = 6 whiskers, 4 animals) and the resulting mean (solid black line). Trial-average response amplitude increased with velocity in all data sets.

