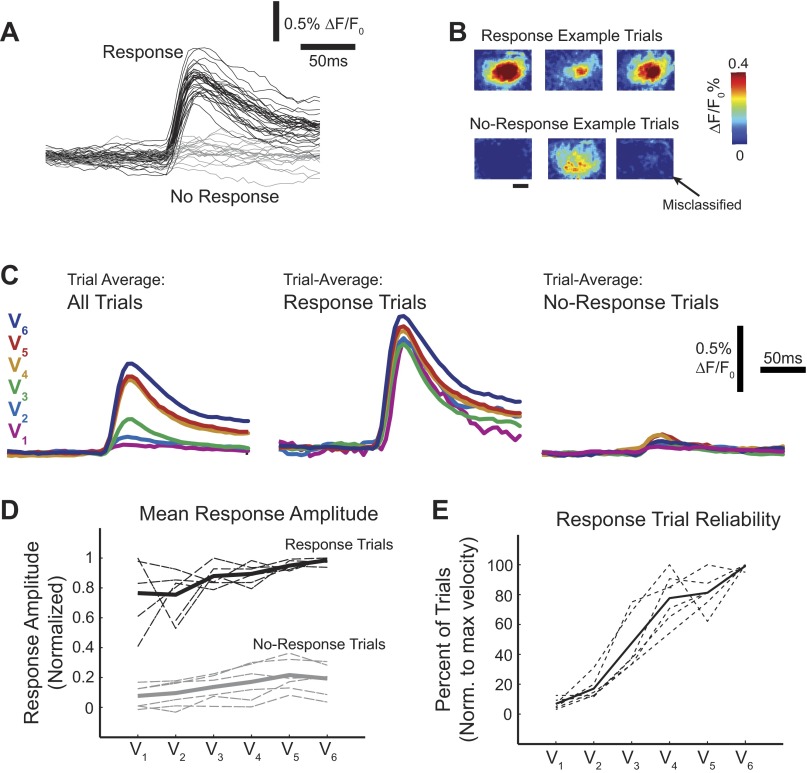
Fig. 4.
Response frequency was modulated by stimulus strength. A: single trials were qualitatively and quantitatively separable into 2 groups: trials with stimulus-evoked activity (response trials; black) and those without (no-response trials; gray). B: example single-trial images from trials shown in A demonstrate variability within the groups. Shown are 3 response trials with variable response amplitude (top). Three no-response trials (bottom) were chosen to represent the types of trials that comprise this category, including a misclassified trial. C: when all trials were included in the average time series of a single data set, there were large differences between the velocities (left), but when the average of only response trials (middle) or only no-response trials (right) was considered, the differences were dramatically reduced. D: results were consistent across all data sets (n = 6 whiskers, 4 animals; dashed lines) for both the response (black) and no-response (gray) average responses. The mean for both groups is depicted with a solid line. Note that higher variability is associated with conditions with the fewest number of trials (low velocities for response trials, high velocities for no-response trials). E: the frequency of response trials increased with stimulus velocity for all data sets (dotted lines), as well on average (mean; solid line).

