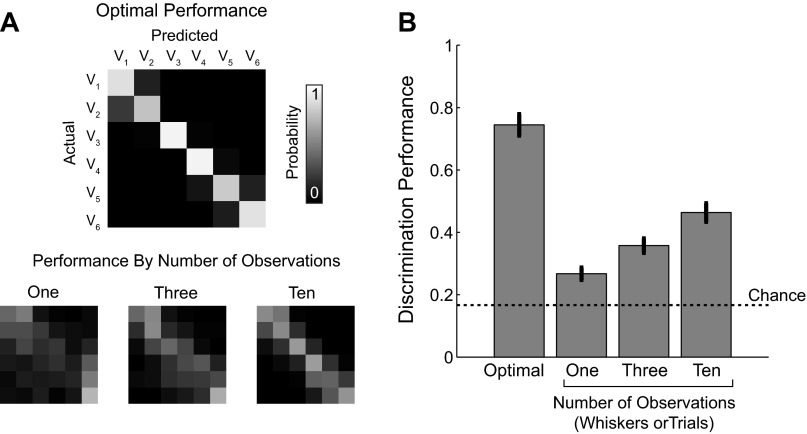
Fig. 9.
Additional observations increased velocity classification performance. A: example performance matrices for the optimal discrimination performance (top) and the performance matrix for an increasing number of observations (1, 3, and 10 observations; bottom). The same labels and scale bar apply to all performance matrices. B: quantification of increased performance across all data sets (n = 6 data sets, 4 animals). Bar graph shows means ± SE.

