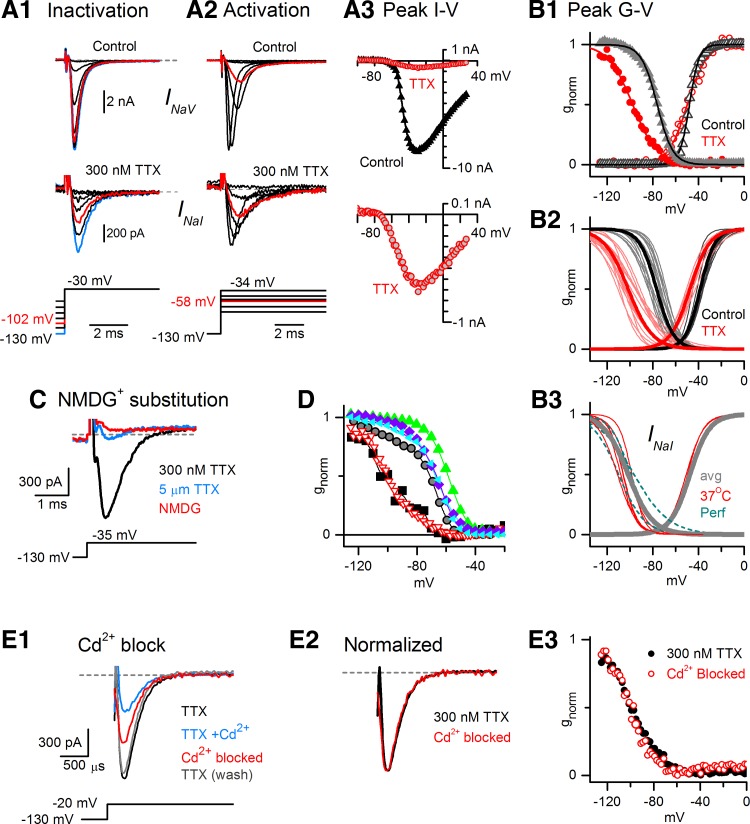
Fig. 3.
Some VGNs expressed TTX-insensitive Na+ current (INaI) with the properties of NaV1.5 channels, in addition to INaS. A and B: current remaining in 300 nM TTX (INaI) had more negative voltage dependence than total NaV current. Data are from P2 VGN. A1: inactivation: as prepulse voltages (bottom) became less negative, the peak current evoked by the step to −30 mV decreased in both control and 300 nM TTX solutions but with different voltage dependence: a prepulse to −102 mV (red traces) decreased total INaV only slightly (top) relative to the peak value (blue traces, prepulse to −130 mV) but inactivated approximately half of INaI (bottom). A2: activation: at −58 mV (red traces), INaV was one-quarter maximal but INaI was nearly half-maximal. A3: current-voltage relation: peak inward current in control and 300 nM TTX solutions (top) for the VGN in A1 and A2 shows a small TTX-insensitive component (red) that activated at relatively negative potentials (y-scale expanded, bottom). B: conductance-voltage (G-V) relations for activation and inactivation. B1: normalized plots of activation (peak current vs. test step, open symbols) and inactivation (peak current vs. prepulse, filled symbols) and Boltzmann function fits (curves); for the VGN in A. Gray triangles, total INaV; red circles, INaI. B2: population data. Thin curves, all fits for room temperature, ruptured-patch data. Thin gray curves, total INaV for VGNs with both INaS and INaI or just INaS. Thin red curves, INaI, obtained in 300 nM TTX. Thick black and red curves, curves generated with average fit parameters, Table 2. B3: INaI voltage range was still negative when recorded at body temperature (red curves) or at room temperature with the perforated patch method (dark cyan curves; inactivation curves only). Thick gray curves, population averages for INaI from B2 (ruptured patch, room temperature). C: INaI in 300 nM TTX (black) was strongly blocked by 5 μM TTX (blue) and abolished by replacing external Na+ with NMDG+ (red, no TTX present), demonstrating that it is carried by Na+ ions flowing through NaV channels (K+ internal, K+ external, P7). D: voltage range of inactivation recorded in 300 nM TTX did not shift negatively with time, as illustrated by inactivation curves taken at different times since patch rupture. Negative inactivation ranges were recorded immediately post rupture: inverted red open triangles, 300 nM TTX, 10 s after rupture. In 0 TTX, inactivation ranges of total INaV did not shift negatively with time: cyan triangles and purple diamonds, 2 VGNs, 7.5 min since rupture; green triangles, a 3rd VGN, 13 min since rupture. Removal of TTX shifted inactivation curves positively despite increasing time since rupture: black squares, in 300 nM TTX; gray circles, the same VGN later, after stopping TTX application. E: INaI (isolated in 300 nM TTX) was partially and reversibly blocked by 200 μM external Cd2+. The Cd2+-blocked (difference) current (E1, P4) had similar time course (E2, normalized E1 data) and voltage dependence (E3, different VGN, P2) to the current in 300 nM TTX, consistent with them being one and the same.

