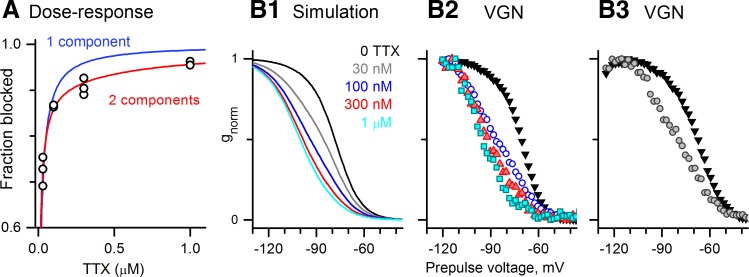
Fig. 4.
TTX-insensitive current was ∼10% of the total Na+ current in VGNs with INaI and was not readily evident in the absence of TTX. A: TTX dose-response data (11 data points from 5 VGNs) deviated from a single-component fit to the Hill equation (Eq. 3, blue, Kd = 13 nM) but was well fit by a 2-component fit (Eq. 5, red), with Kd1 = 8 nM, Kd2 = 774 nM, and A (fraction of TTX-sensitive component) = 0.92. B: inactivation curves recorded for different TTX doses are consistent with the predictions of the 2-component fit. B1: voltage dependence of inactivation at 5 TTX concentrations, simulated with Eq. 6: 10% INaI (Vinact = −96 mV, s = 8 mV, Kd2 = 700 nM) and 90% INaS (Vinact = −74 mV, s = 5.6 mV, Kd1 = 5 nM). Parameter values for TTX dependence were close to the results of the 2-component fit (Kd1, Kd2, A). Inactivation parameters were the means obtained for INaI and INaS (Table 2). B2 and B3 inactivation curves from 2 representative VGNs (P2 and P1, respectively) at different TTX doses resemble the simulations in B1 at corresponding TTX doses. Key colors in B1 apply to B1-B3.

