Fig. 7.
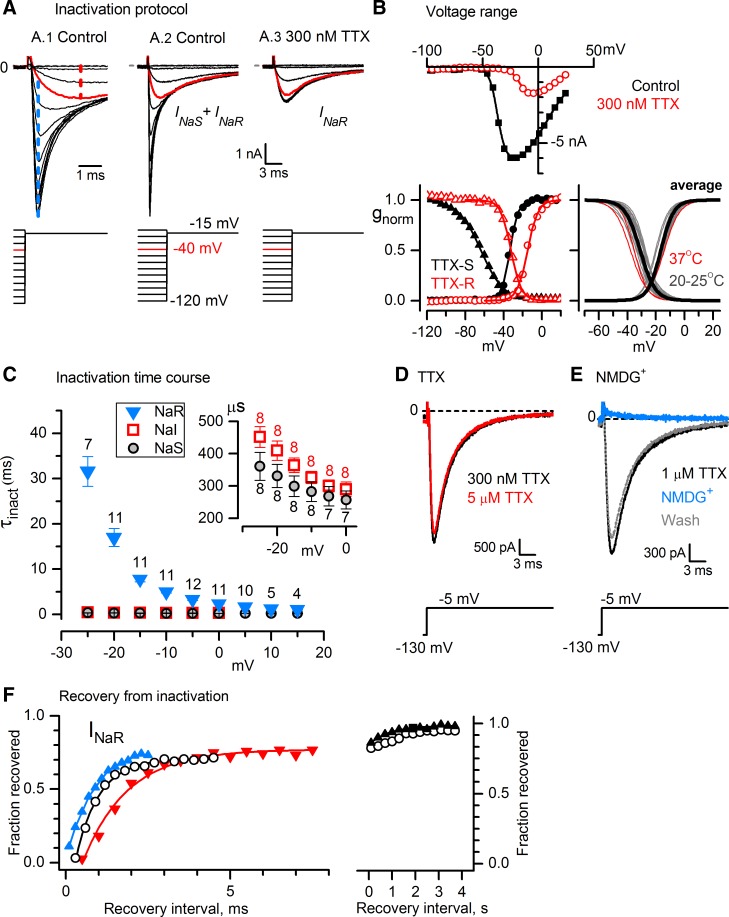
Some VGNs expressed a TTX-resistant NaV current (INaR) with properties of NaV1.8 channels. A: in responses to an inactivation protocol with VH −70 mV, 80-ms prepulse, and test step to −15 mV, INaR was distinguished from INaS by its less negative voltage dependence and slower time course for P6 VGN. Vertical scale bar applies to A1-A3; A1 has a shorter time scale than A2 and A3. A1 and A2: control data (K+ internal, K+ external). A1's expanded time scale shows separation of INaS (blue dashed line) and INaR (red dashed line) with voltage and time, allowing estimation of their amplitudes in 0 TTX (see results). After a prepulse to −40 mV (red traces), INaS was almost completely inactivated but INaR was minimally inactivated; thus peak current after a −40-mV prepulse provided an estimate of INaR. Conversely, the difference current (blue dashed line) between −120- and −40-mV prepulses was almost entirely INaS. This method was validated by blocking INaS with 300 nM TTX (A.3), which did not affect current after the −40-mV prepulse (red trace, compare to control), confirming that it was INaR. B: voltage ranges of activation and inactivation. Solutions: Cs+ internal, Cs+ external. Top: peak I-V relations in control and 300 nM TTX, for the cell in A. Bottom left: activation data (circles) and inactivation data (triangles) for INaS obtained by subtracting traces in 300 nM TTX from control traces (black) and for INaR obtained in 300 nM TTX (red), for the cell in A. Data were fitted with Eqs. 1 and 2. INaR inactivation curve: Vinact = −32.1 mV, s = 5.4 mV; activation curve: Vact = −14.8 mV, s = 5.4 mV, gmax = 51.1 nS. INaS inactivation curve: Vinact = −63.6 mV, s = 11.9 mV; activation curve: Vact = 33.4 mV, s = 4.3 mV, gmax = 106.0 nS. For B, g was normalized to gmax. Bottom right: superimposed activation and inactivation curves from individual fits (thin gray lines, room temperature) and average fits (thick black lines) are shown. Average parameter values are in Table 2. Thin red lines, data at 37°C, not in average. C: time constants of fast inactivation of INaR decreased 10-fold to ∼2 ms as voltage was made less negative over the range from approximate Vinact to +15 mV; prepulse was −125 mV, 50 ms. Numbers of values averaged (one per VGN) are indicated above each data point. Inset: much smaller averaged values for INaS and INaR on an expanded ordinate. D: INaR was blocked only slightly more (7%) by 5 μM TTX than by 300 nM TTX. Data are from P7 VGN. E: INaR was completely and reversibly eliminated by replacing external Na+ with NMDG+. Data are from P5 VGN. F: INaR recovery at −90 mV from inactivation during 25-ms steps at 0 mV, in 4 VGNs. INaR recovered ∼75% within ms (left) but took seconds to recover fully (right). Solutions were Cs+ internal and Cs+ external except for blue triangles: K+ internal, K+ external (P7). Open circles, P7 (same VGN at left and right). Red inverted triangles, P2. Black triangles, P5.

