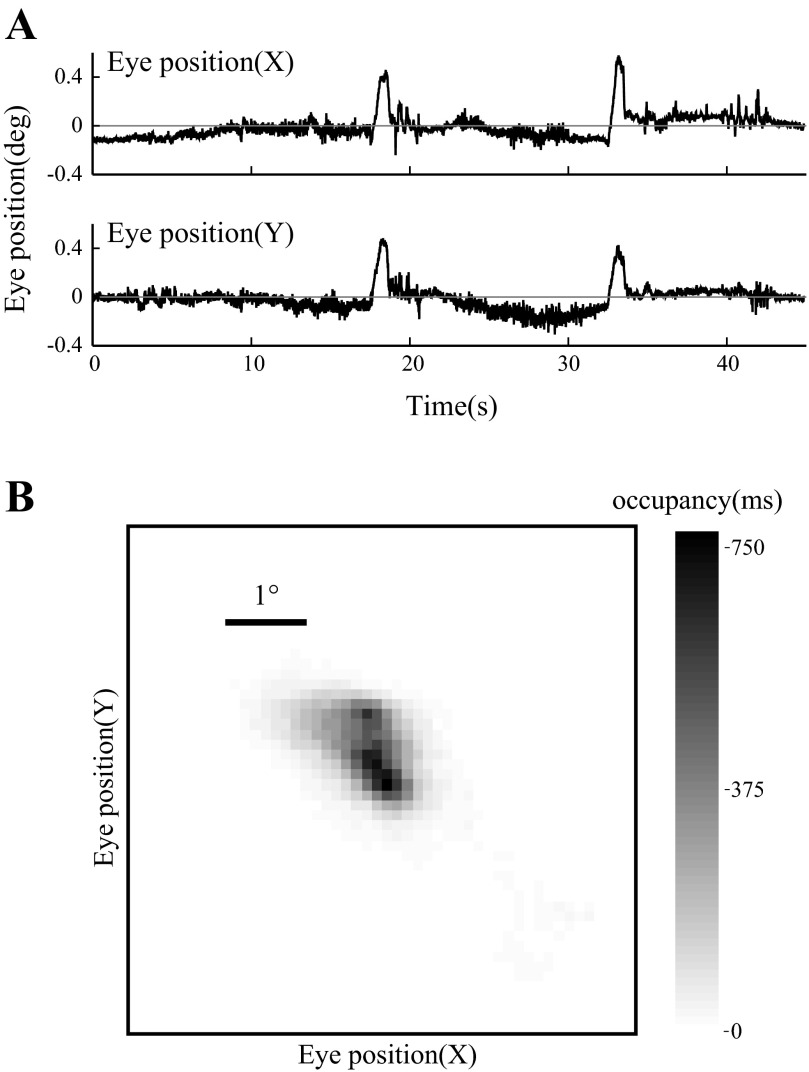
Fig. 1.
Eye position during visual stimulation. A: recorded horizontal (X) and vertical (Y) eye position as a function of time during a 45-s trial in which a drifting grating was presented. The 0° position is operationally defined as the mean eye position over the recording session. B: eye position density represented in 2-dimensional space during the trial plotted in A. Grayscale indicates amount of time spent at each location in ms. Scale bar, 1° visual angle.

