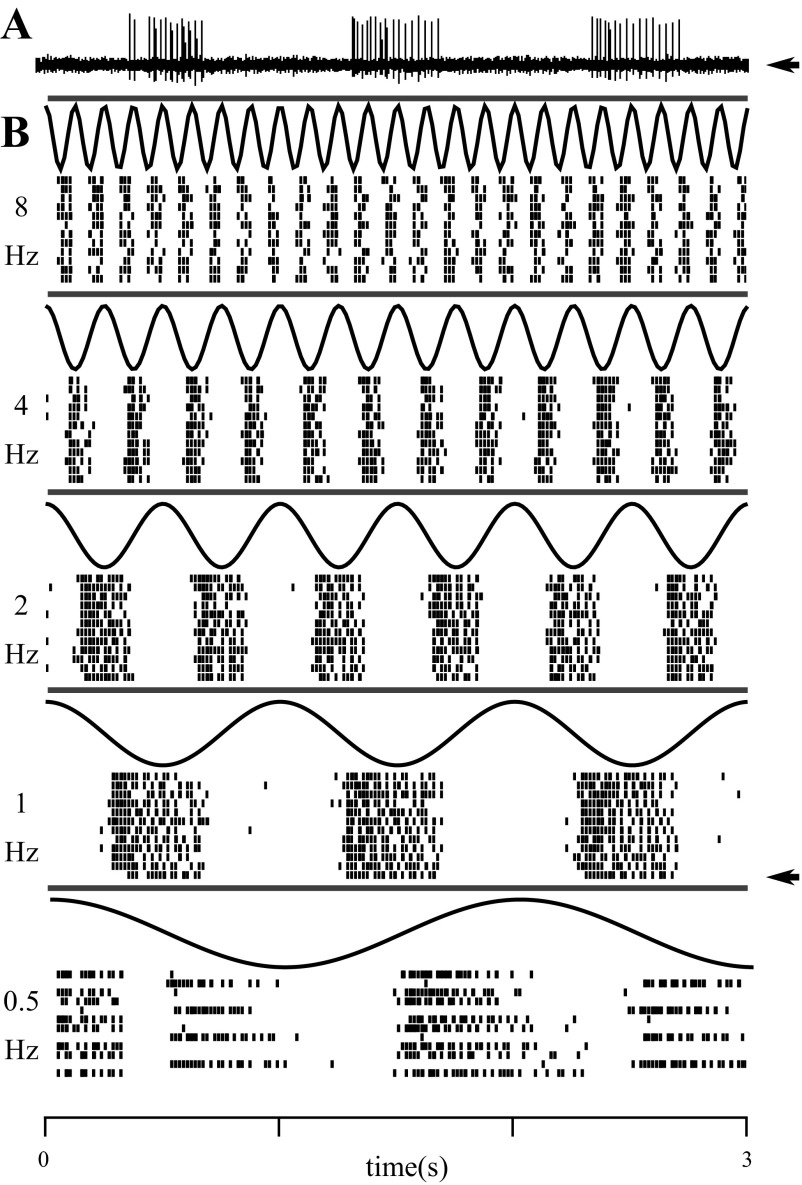
Fig. 2.
Responses of a single unit to full-field modulation at different temporal frequencies. A: voltage trace from a single unit recorded from the dLGN of an awake rat. The raster corresponding to this trial is marked with an arrow in B. B: black curves show the luminance time courses sampled at the frame rate (integrated within frame). Each row of a raster indicates responses for a single trial, and each tic mark indicates the time of a single action potential. The 12 trials recorded at each temporal frequency were interleaved during the experiment but are grouped by frequency for display. The time axis at bottom applies to all panels.

