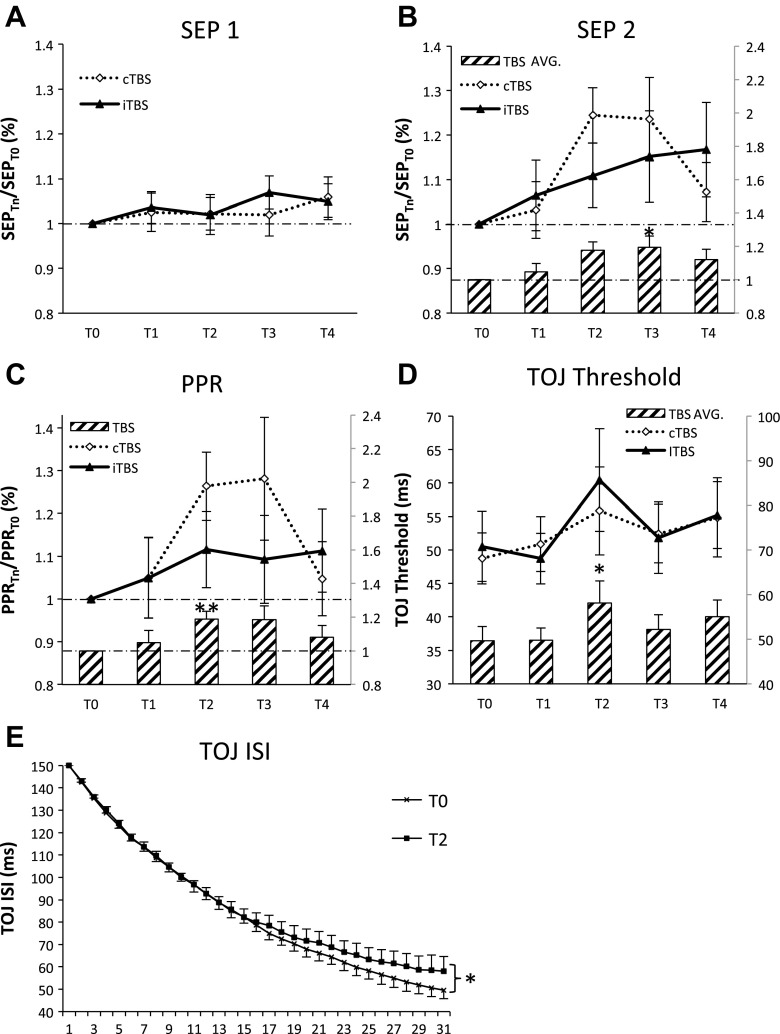
Fig. 2.
Plasticity effects of cTBS vs. iTBS. All somatosensory cortex (SI) physiology data were normalized at each post-TBS time block to T0 except for TOJ where T0 data were not statistically different between cTBS and iTBS. Values above the horizontal broken line correspond to an increase in the amplitude (SEP 1 and SEP 2) or increase in the PPR compared with baseline values. A: group-averaged SEP 1 (with SE) (N = 16). B: group-averaged SEP 2 (with SE) (N = 15). Histogram depicts the main effect of time (average of cTBS and iTBS) with an increase in SEP 2 amplitude at T3. C: group-averaged PPR (with SE) (N = 15). Post hoc 2-tailed t-tests revealed increased PPR at T2. D: group-averaged TOJ (with SE) (N = 14). Histogram depicts the main effect of time showing a significant increase in TOJ threshold at T2. E: TOJ averaged over cTBS and iTBS (with SE) for T0 and T2 as a function of trial number (N = 14). Impairments occur as the participant reaches threshold, but not at suprathreshold ISIs. Asterisks indicate significant post hoc Tukey's honest significant difference (HSD, *) and 2-tailed t-tests (**).

