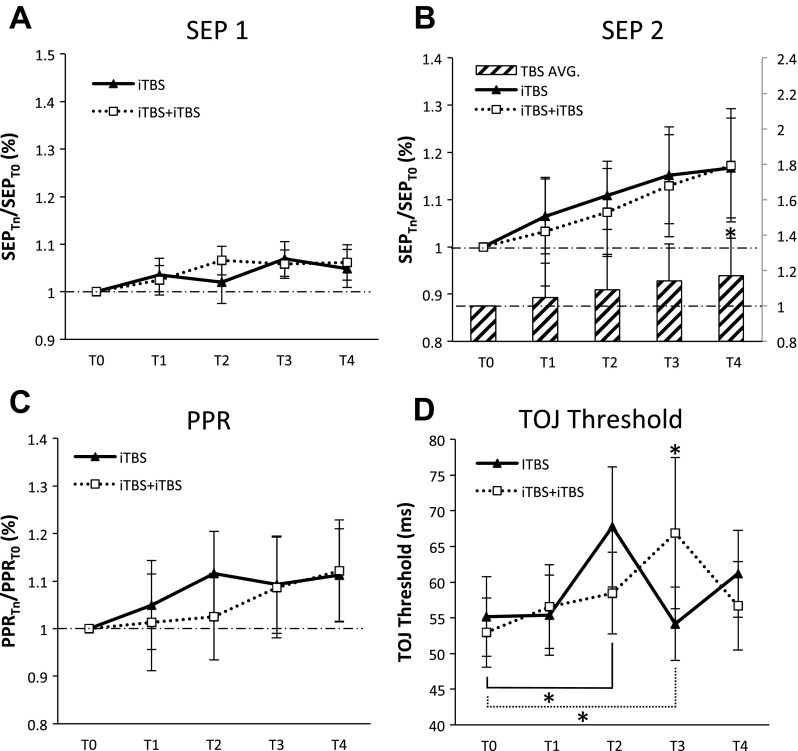
Fig. 4.
Metaplastic effects of iTBS. All data for SEP 1, SEP 2, and PPR were normalized to T0 when T0 was different between iTBS and iTBS-iTBS. A: group-averaged SEP 1 (with SE) (N = 16). B: group-averaged SEP 2 (with SE) (N = 15). A significant effect of time revealed differences between T1 and T4 (main effect shown in histogram). C: group-averaged PPR (with SE) (N = 15). D: group-averaged TOJ (with SE) (N = 16). Significant interaction revealed as increase in TOJ at T3 following iTBS-iTBS compared with iTBS and impairment in TOJ following iTBS at T2 and iTBS-iTBS at T3. *Significant post hoc Tukeys.

