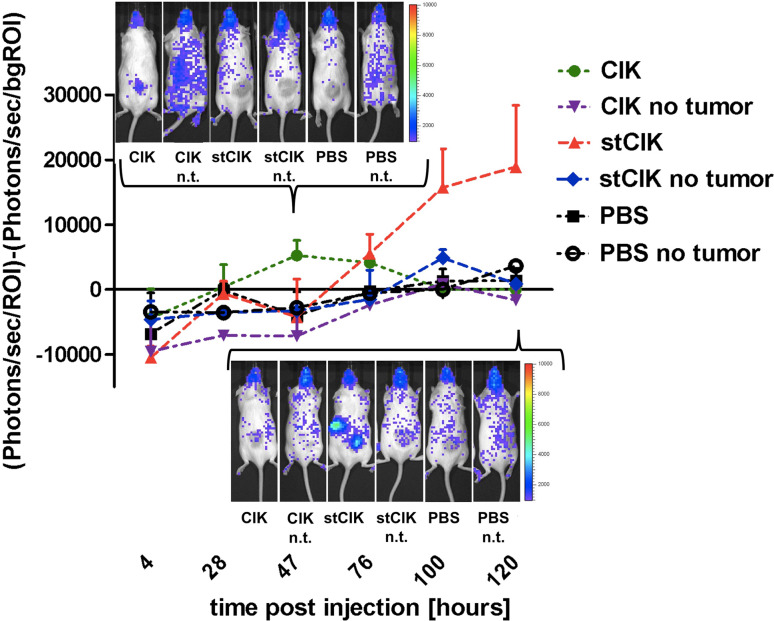
Fig. 2.
Tumor homing and expansion of stCIK cells compared to CIK cells in vivo as assessed by in vivo bioluminescence imaging (BLI) over a 5-day period after cell injection. Light emission was measured at the shaved tumor site and normalized by subtracting a background signal from a reference area in the neck area. Selected BLI images are shown for illustration purposes for day 2 and day 4. Error bars represent standard deviation

