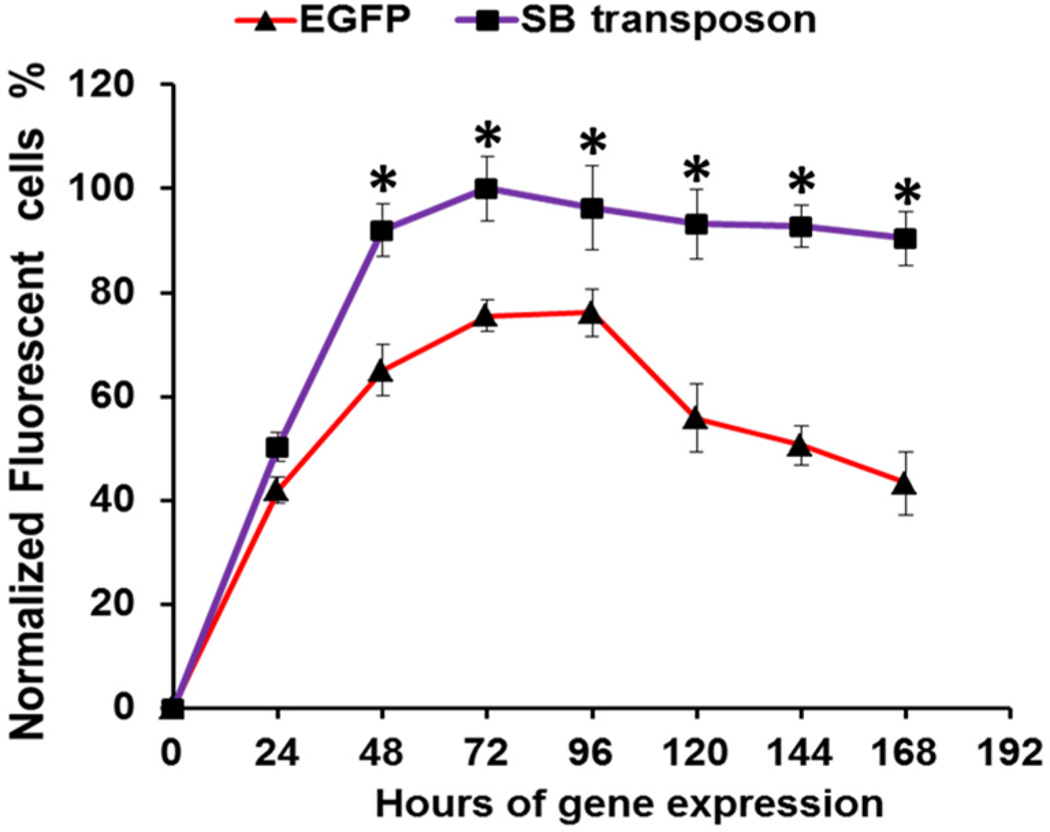
Figure 6.
Time course comparison of gene expression of SB transposon system and control EGFP plasmid showing the long-lasting EGFP gene expression delivered in the form of SB transposon system. EGFP expression level of SB transposon system in rMSCs reached a maximum in 72 h, which was set as 100%. Data are shown as mean ± standard deviation (n = 3). Asterisk denotes p < 0.05 when comparing the gene expression of SB transposon system with control EGFP plasmid.

