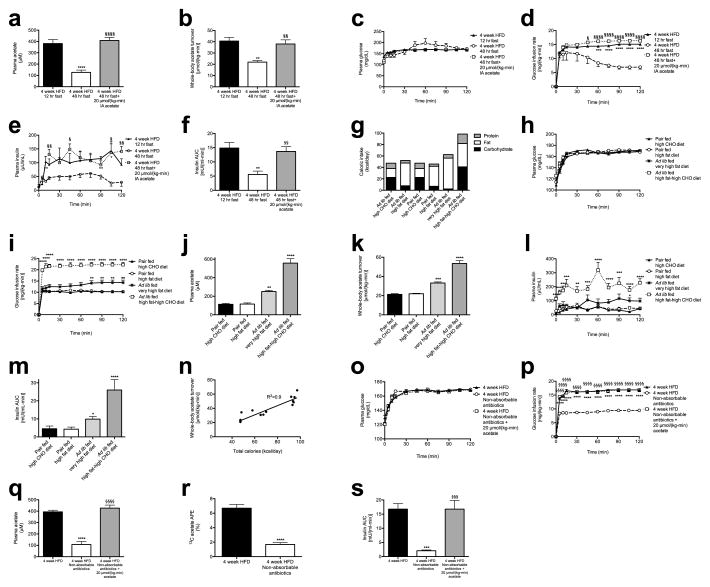
Extended Data Fig. 4.
Increasing total caloric intake leads to increased acetate turnover and GSIS via the microbiota in rats. (a), (b) Plasma acetate and whole-body acetate turnover. In panels (a)–(f), *P<0.05, **P<0.01, ***P<0.001, ****P<0.0001 vs. 12 hour fasted rats; §P<0.05, §§P<0.01, §§§P<0.001, §§§§P<0.0001 vs. 48 hour fasted rats. (c), (d) Plasma glucose and glucose infusion rate during a hyperglycemic clamp. (e), (f) Plasma insulin and insulin AUC during the clamp. (g) Caloric intake from protein, fat, and carbohydrate. In panels (g)–(m), each group was compared to pair fed, high carbohydrate fed rats. (h), (i) Plasma glucose and glucose infusion rate in the hyperglycemic clamp. In all panels, *P<0.05, **P<0.01, ***P<0.001, ****P<0.0001 vs. pair fed rats given the high CHO diet. (j), (k) Plasma acetate and whole-body acetate turnover. (l), (m) Plasma insulin and insulin AUC during the hyperglycemic clamp. (n) Linear regression: whole-body acetate turnover vs. total caloric intake in each diet group. (o), (p) Plasma glucose and glucose infusion rate during a hyperglycemic clamp in 4 week HFD rats treated with broad-spectrum non-absorbable antibiotics. In panels (o)–(r), ***P<0.001, ****P<0.0001 vs. HFD rats; §§§P<0.001, §§§§P<0.0001 vs. antibiotics-treated rats. (q) Plasma acetate. (r) Plasma 13C acetate enrichment following three days of feeding 13C bicarbonate food and water. Data were compared using the 2-tailed unpaired Student’s t-test. (s) Insulin AUC during a hyperglycemic clamp. Data are mean ± S.E.M. of n=6 per group. In all panels, data are the mean ± S.E.M. of n=6 rats per group, with groups compared by one-way ANOVA with Bonferroni’s multiple comparisons test, unless otherwise stated.

