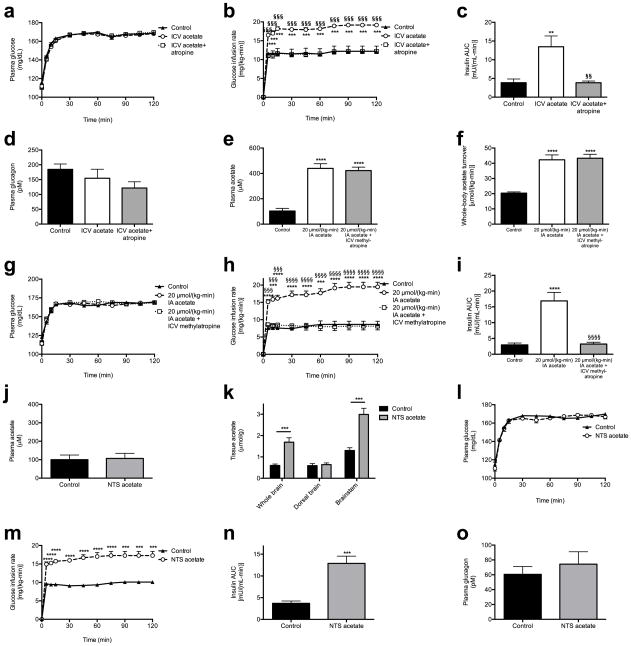
Extended Data Fig. 8.
Acetate drives GSIS via parasympathetic activation. (a), (b) Plasma glucose and glucose infusion rate during a hyperglycemic clamp in rats treated with ICV acetate. In panels (b)–(d), **P<0.01, ***P<0.001 vs. controls; §§P<0.01, §§§P<0.001 vs. ICV acetate treated rats by one-way ANOVA with Bonferroni’s multiple comparisons test. (c) Plasma insulin AUC. (d) Plasma glucagon. (e), (f) Plasma acetate and whole-body acetate turnover in rats treated with systemic intra-arterial acetate and ICV methylatropine. In panels (e)–(i), ***P<0.001, ****P<0.0001 vs. controls; §§§P<0.001, §§§§P<0.0001 vs. acetate-infused rats. (g), (h) Plasma glucose and glucose infusion rate during a hyperglycemic clamp. (i) Plasma insulin AUC during the clamp. (j), (k) Plasma and brain tissue acetate in rats given an injection of acetate into the NTS. (l), (m) Plasma glucose and glucose infusion rate during a hyperglycemic clamp. (n) Plasma insulin area under the curve during the clamp. (o) Plasma glucagon. In all panels, data are the mean ± S.E.M. of n=6 animals per group, with comparisons by one-way ANOVA with Bonferroni’s multiple comparisons test [panels (a)–(i)], or by the 2-tailed unpaired Student’s t-test [panels (j)–(o)].

