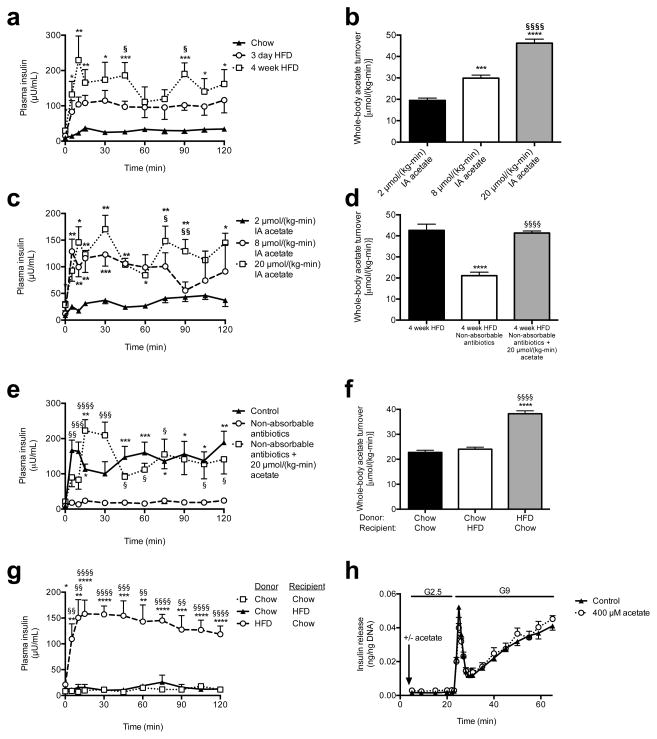
Fig. 3.
Acetate turnover drives GSIS. (a) Plasma insulin in a hyperglycemic clamp. *P<0.05, **P<0.01, ***P<0.001 vs. chow; §P<0.05 vs. 3 day HFD. (b), (c) Acetate turnover and GSIS in rats given acute acetate. *P<0.05, **P<0.01, ****P<0.0001 vs. 2 μmol/(kg-min); §P<0.05, §§P<0.01, §§§§P<0.0001 vs. 8 μmol/(kg-min). (d), (e) Acetate turnover, GSIS. *P<0.05, **P<0.01, ****P<0.0001 vs. controls; §P<0.05, §§P<0.01, §§§P<0.001, §§§§P<0.0001 vs. antibiotics. (f), (g) Whole-body acetate turnover, GSIS. *P<0.05, **P<0.01, ***P<0.001, ****P<0.0001 vs. chow donor/chow recipient; §§P<0.01, §§§P<0.001, §§§§P<0.0001 vs. chow donor/HFD recipient. (h) GSIS in isolated islets (KRB buffer; n=4 replicates per group). Unless otherwise specified, n=6 replicates per group.

