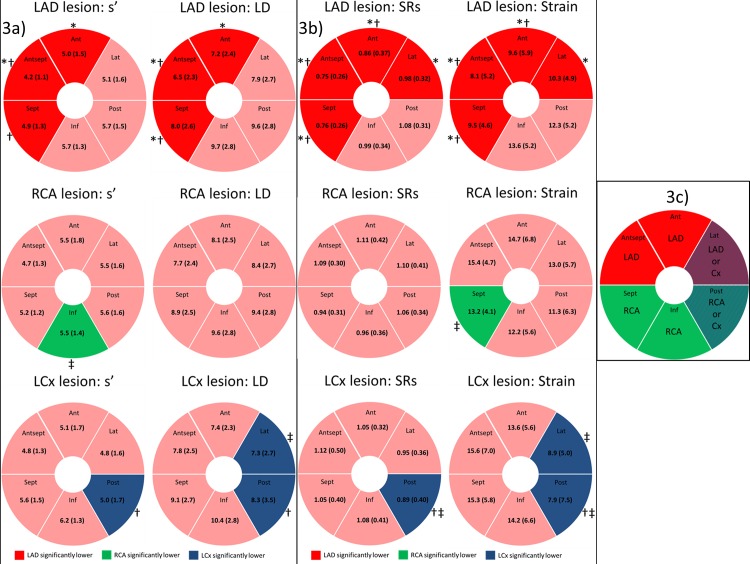
Fig 3. Regional longitudinal deformation and culprit lesion.
Patients stratified according to the location of their culprit lesion in the left anterior descending (LAD), the right coronary artery (RCA) or the left circumflex coronary artery (LCx). Fig 3A: The mean value of the TDI parameters at all six myocardial walls for patients stratified according to the location of their culprit lesion. Fig 3B: The mean value of the 2DSE parameters at all six myocardial walls for patients stratified according to the location of their culprit lesion. Fig 3C: The typical distribution of coronary artery blood supply to the 6 myocardial walls is displayed[15]. * indicates a p-value < 0.05 (Bonferroni corrected) when comparing LAD lesions with RCA lesions. † indicates a p-value < 0.05 (Bonferroni corrected) when comparing LAD lesions with Cx lesions. ‡ indicates a p-value < 0.05 (Bonferroni corrected) when comparing RCA lesions with Cx lesions. Values represent mean (±SD). LAD = Left Anterior Descending coronary artery, RCA = Right coronary artery, LCx = Left Circumflex coronary artery, s’ = peak systolic longitudinal mitral annular velocity determined by color Tissue Doppler Imaging, LD = Mitral annular longitudinal displacement determined by color TDI, SRs = Peak longitudinal systolic strain rate, ANT = Anterior, LAT = Lateral, POST = Posterior, INF = Inferior, SEPT = Septal, ANT SEPT = Anterior septal.

