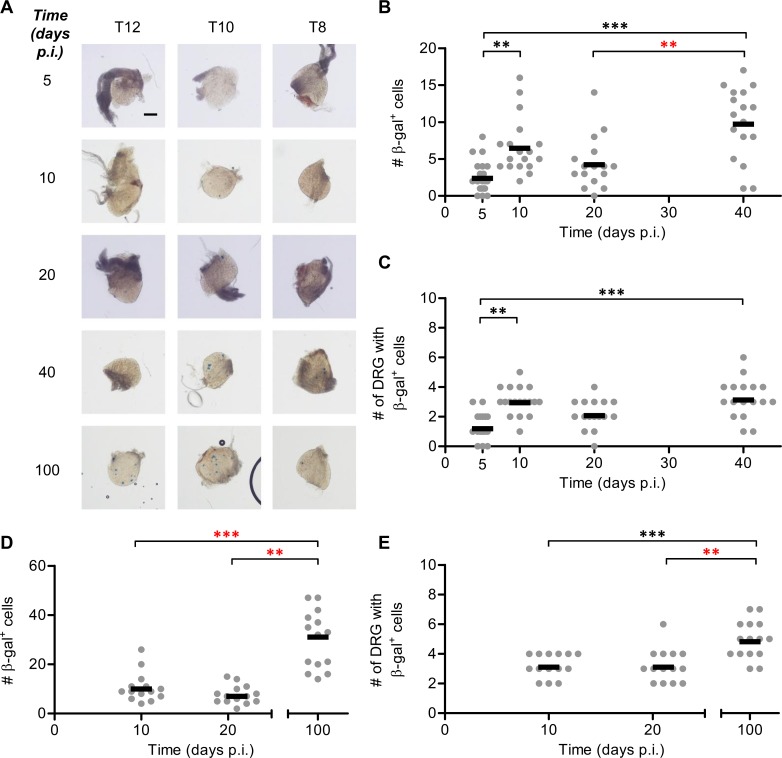
Fig 5. The promoter for gB drives protein expression during latency.
Groups of ROSA26 mice were infected with HSV-1 pgB_eGC by tattoo on the flank and were culled at either (B, C) 5, 10, 20 and 40, or (D, E) 10, 21 and 100 days p.i. for determination of the number of β-gal+ cells per DRG. (A) Representative photomicrographs of DRG at spinal levels T12, T10, and T8 of a single mouse for each day p.i. taken at a 40× magnification (scale bar = 300 μm, as indicated on top left image). To examine the accumulation of β-gal+ cells throughout the acute infection and establishment of latency, (B) the total number of β-gal+ cells per mouse and (C) the spread of virus as indicated by the number of DRG containing β-gal+ cells was determined. The data are pooled from 5 independent experiments, with each point represents a single mouse and the bar represents the mean cell count (n = 16–18 per day p.i.). To examine the accumulation of β-gal marked cells in ROSA26 mice infected with HSV-1 pgB_eGC over the long term the (D) total number of β-gal+ cells per mouse and (E) the spread of virus as indicated by the number of DRG containing at least one β-gal+ cell is shown. The data are pooled from 3 independent experiments (n = 14–15). (**p < 0.01, ***p < 0.001; red denotes differences of particular note).

